


Watch Out for this Bitcoin Bearish MA Crossunder Ahead

IN TODAY’S LETTER
What we cover: An important $BTC crossunder may soon occur. Hold Time analysis shows a mixed (but ultimately positive) outlook. The Balance of Assets belonging to HODLers hits a new high.
TODAY’S STATS
Bitcoin’s 50ma May Soon Cross Below its 100ma
While Bitcoin and Ether remain in their daily bull flag patterns - bullish by definition - both major crypto assets may also soon see their respective 50-day moving averages cross below their 100-day moving averages - a potentially bearish setback in the short-term. While this 50ma < 100ma crossunder has not yet occurred, it may happen within days as Bitcoin and Ether continue to consolidate following their double-digit March gains. While the long-term picture remains bullish - more on that in today’s Technical View later - let’s run the stats for this looming 50ma < 100ma crossunder to get a better sense of what lies ahead for Bitcoin.
BITCOIN (BTC/USD). Daily Chart with 50ma and 100ma.

Our first query is simple: how has Bitcoin performed historically when its 50ma crosses below its 100ma? We’ll first look at a simple “sell 30 days later” scenario before looking at various holding times.
OUR BITCOIN QUERY'S SETUP CONDITIONS:

CONDITION 1: Bitcoin's 50ma crosses below its 100ma


ENTRY AND EXIT CONDITIONS:

1. ENTRY CONDITION: Enter long ("buy") at the open of the next daily candle
2. EXIT CONDITION: Exit ("sell") 30 days later
Here are the results using a 30-day hold:
BITCOIN (BTC/USD). Query Results for BTC with a 30-day Hold. 2011-Now.

Were the 50ma to cross below the 100ma in the coming days, the short-term outlook is negative using a 30-day hold, with an average trade of -2.23% over Bitcoin’s full history of reliable data (2011 - now). The 20 instances of this crossunder have only been profitable 40% of the time with nearly equal best trade (+53.5%) and worst trade (-45.9%) stats. Any Profit Factor below 1.00 indicates a negative expectation so this 0.72 reading confirms the mildly bearish outlook. As for the worst trade of -45.9%, it occurred in Bitcoin’s early history (September 2011), and all losing trades after this worst trade result have been no worse than -27.1%.
Now let’s look at Bitcoin’s results for Average Trade across various holding times ranging from 7 days to a 180 days using data from 2011- Now. Note that the Win % shows how many trades were profitable, hypothetically speaking.
BITCOIN (BTC/USD). Hold Time Results for Today’s Conditions. 2011-Now.

For each of the holding times up to 30 days, the average trade is mildly negative with average returns ranging between -1.3% to -2.8% and poor Win % stats. The 60-day and 90-day hold times show improvement and a positive average trade, while a 180-day hold shows an explosive average trade of +133.6%. Still months ahead of the 2024 Halving event, the full range of today’s outlook may be a fairly close template for what we can anticipate over the next 6 months - mixed results in the short-term and improving results in the intermediate-term as we get closer to the Halving.
THE TECHNICAL VIEW
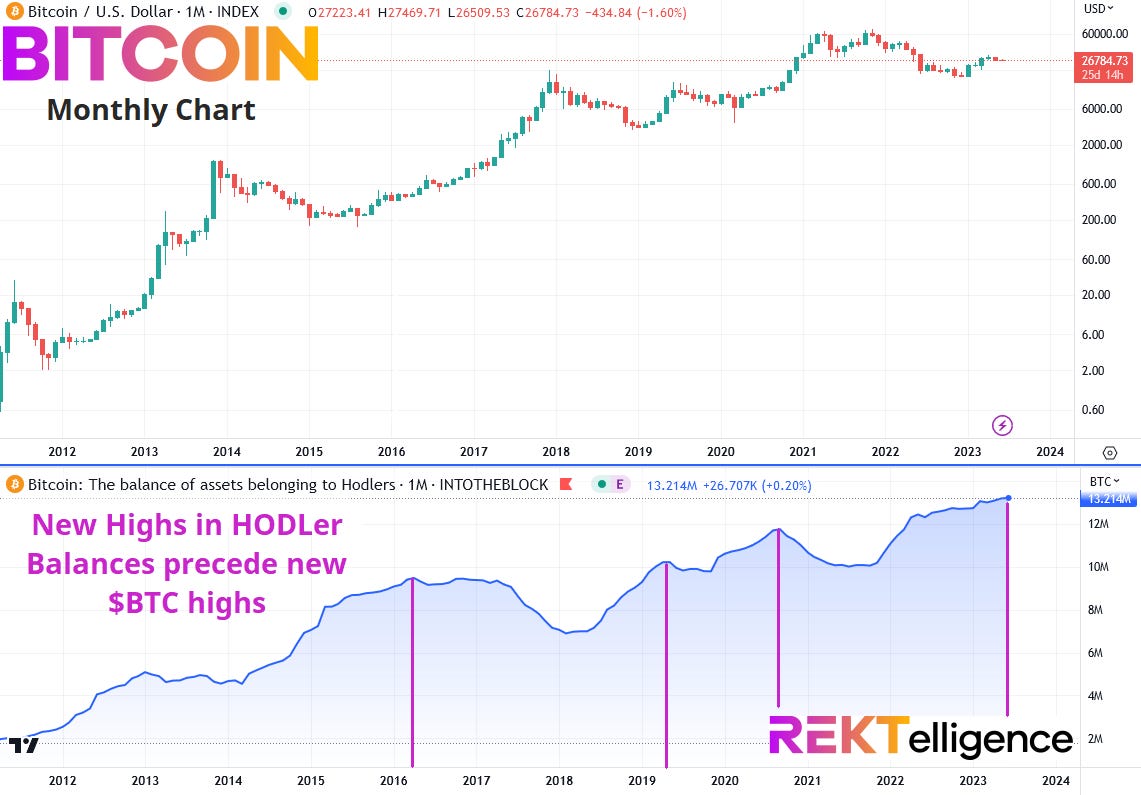
New HODLer Balance Highs Suggest New Bitcoin Highs Will Follow
Beyond the short-term and intermediate-term horizons, Bitcoin continues to see the Balance of Assets belonging to HODLers (one-year holders and beyond) climb to new highs. New highs in HODLer balances have historically preceded new highs in price (see vertical lines on chart below), suggesting that Bitcoin is currently on track to move beyond the 70,000 mark in the next bull run. For those thinking ahead, note the bearish divergences which have occurred ahead of Bitcoin tops, in which the HODLer balances have fallen before Bitcoin tops out, indicating that long-term holders are finally willing to part with their coins while the bulls are still running. If historical trends continue to hold up, we will be revisiting this chart in the coming months, looking for any meaningful negative divergence suggesting it may be time to de-HODL and lock in gains.
BITCOIN (BTC/USD). Monthly Chart with Balance of Assets belonging to HODLers.
THE TLDR
A Few Key Takeaways
✔ Were the 50ma to cross below the 100ma in the coming days, the short-term outlook is negative using a 30-day hold
✔  Today’s outlook may be a fairly close template for what we can anticipate over the next 6 months
✔ New highs in HODLer balances have historically preceded new highs
✔ Bitcoin is currently on track to move beyond the 70,000 mark in the next bull run
peace_love_crypto-DB
IMPORTANT DISCLAIMER
The information presented and made available in this newsletter is intended for educational purposes only. THE INFORMATION IS NOT AND SHOULD NOT BE CONFUSED WITH INVESTMENT ADVICE AND DOES NOT ATTEMPT OR CLAIM TO BE A COMPLETE DESCRIPTION OF ANY SPECIFIC COINS, TOKENS OR MARKETS OF ANY KIND, BUT RATHER EDUCATIONAL EXAMPLES OF THE APPLICATION OF TECHNICAL ANALYSIS AND QUANTITATIVE ANALYSIS TO THE MARKET. This information has been presented and prepared without regard to any particular person's investment objectives, financial situation and particular needs because as individuals come from diverse backgrounds, with diverse objectives and financial situations. This information is of a general nature only so you should seek advice from your investment advisor or other financial professional as appropriate before taking any action. The opinions and analyses included herein are based on sources and data believed to be reliable and are presented in good faith, however no representation or warranty, expressed or implied is made as to their completeness or accuracy. It is imperative to understand your investment risks since all stock investments involve significant risk. The user of REKTelligence’s newsletters, podcasts, courses, coaching and other educational services agrees to indemnify and hold harmless REKTelligence LLC from and against any and all liabilities, expenses (including attorney's fees), and damages arising out of claims resulting from the use of this educational content. REKTelligence LLC is not a licensed investment advisor.
© 2023 REKTelligence LLC