


This Hugely Bullish Crossover Just Occurred
Bitcoin poised to rally after 100SMA > 365SMA crossover, but beware of turbulence.

IN TODAY’S LETTER
Greetings REKTelligent! Here’s what we cover:
✔ A Recent MA Crossover with highly bullish stats
✔ MA Crossover holding time insights
✔ Monthly Supply Zone looms large overhead
✔ Crypto-Skeptical Partygoers & the Wall of Worry
TODAY’S STATS
Hugely Bullish Crossover Precedes Most Halving Events
After holding above the 30,000 level for four days straight, Bitcoin begins the week under downside pressure and threatens to close below the whole round 30k number for the first time since last Wednesday. While Bitcoin’s near-term prospects may be mixed - more on this in our Technical View later - the recent 100-day SMA crossover above the 365-day SMA (one-year moving average) is both a rare occurrence with few historical instances and a technical event with remarkably bullish results from 2011 to now.
BITCOIN (BTC/USD). Daily Chart with last week’s 100SMA-365SMA crossover.

Let’s take a look at Bitcoin data, employing naïve (simplistic) entry and exit conditions. As always, we’re not necessarily seeking to trade the following logic as a system but rather asking a question of the data (i.e., making a query) to better understand what’s happened historically under similar conditions to the present.
Our query’s entry/exit conditions:
Enter (“buy”) Bitcoin (BTC/USD) once the 100-day simple moving average (100SMA) closes above the 365-day simple moving average (365SMA)
Exit (“sell”) Bitcoin (BTC/USD) once the 100-day simple moving average (100SMA) closes below the 365-day simple moving average (365SMA)
Here are the results:
BITCOIN (BTC/USD). Query Results for 100SMA-365SMA Crossover. 2011 - Present.

Before we examine these results, it’s important to mention that we’ll normally aim for queries which produce a much larger number of instances and have greater statistical significance. That said, testing two longer moving averages such as these on a relatively new asset for which reliable data only exists from 2011 on produces few results by definition.
The above results show that only four hypothetical trades have occurred in Bitcoin’s history, meaning there was an entry event (100SMA > 365SMA) and a completed exit event (100SMA < 365SMA). Together, these constitute a trade, and there have been four trades up to now. The crossover event which occurred last week at the “close” of the 4/09/23 daily candle constitutes a new entry but not yet a trade because it’s still open. Out of the four trades, three have been positive for a Percent Profitable (also called “win %”) of 75 percent. The Profit Factor metric indicates that the gross sum of hypothetical gains is nearly 17.5 times greater than the gross sum of hypothetical losses. While it’s easier to have a mind-blowing Profit Factor with a small number of trades (such as we have here), the Profit Factor for this crossover is nevertheless outstanding. Lastly, these crossover conditions have produced a best trade of +4540% with a worst trade of only -27.7%, resulting in an average trade of +1663%. While bull cycle gains have diminished over time - something we’ll delve into in a future letter - a potential move equivalent to the historical average trade from the current crossover entry level hit last week would eventually see Bitcoin at $471,346. Again, we don’t anticipate this degree of upside, but even a fraction of the average trade would be impressive.
Interestingly, each of the first three completed trades saw its 100SMA > 365SMA entry event occur less than one year before the next Bitcoin Halving event. Only the fourth trade saw an entry following the 2020 halving due to the sharp drop in Bitcoin which occurred at the start of the pandemic, causing a closed loss on the preceding third trade. This resulted in the one and only loss, with a re-entry crossover signal occurring roughly four months later. Overall, this crossover’s parallels to the halving are relatively strong to date.
Now let’s forget about the old exit condition, and simply see how the same entry event (100SMA > 365SMA crossover) fared when held for a set number of days. What’s the point? By examining average gain, average loss, and the win rate for a variety of holding times, we can use past tendencies to inform and potentially improve our assessment of risk and reward in the future.
BITCOIN (BTC/USD). Holding Time Results for 100SMA-365SMA Crossover. 2011 - Now.
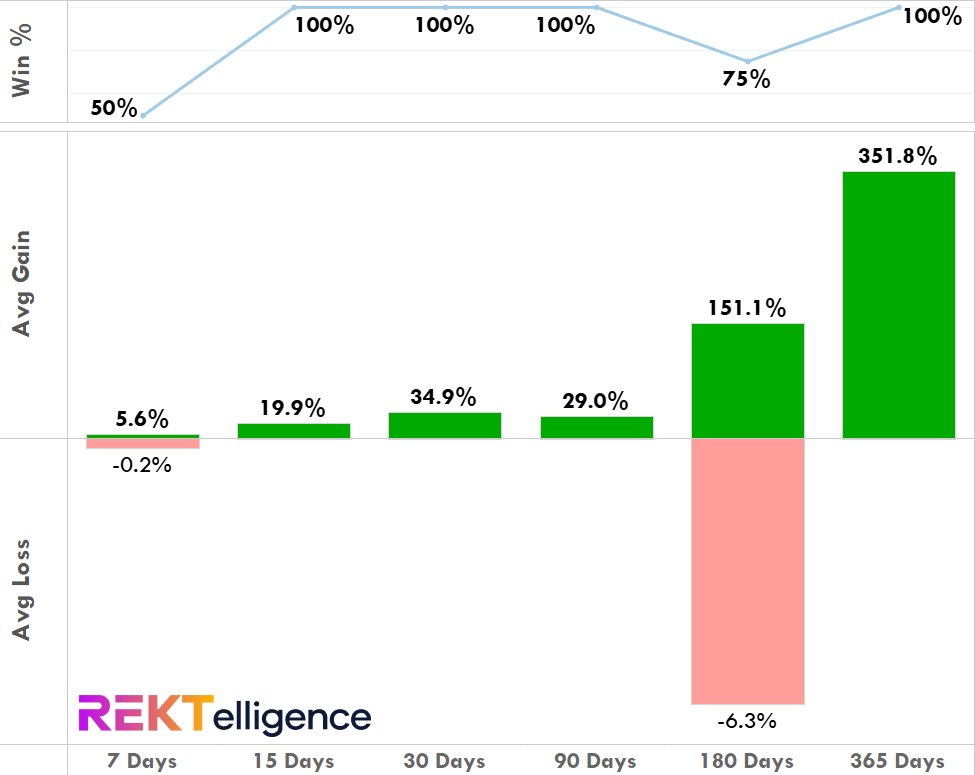
Using a hypothetical 15-day to 90-day hold, we see fairly uniform results with no losing trades and respectable average gains ranging from 19.9% up to 34.9%. Starting with the 180-day hold, one trade produces an average loss of -6.3% while overall average gains jump to +151.1%. Moving out to a hypothetical one-year hold, the average gain more than doubles to +351.8%, with no losing trades. Instances may be few, but the results are mighty.
THE TECHNICAL VIEW
Monthly Supply Zone Looms Large
Bitcoin’s 20-month moving average has historically acted as a brutal technical dividing line between bull and bear periods with the coldest parts of all past crypto winters occurring below it. On the flip side, when Bitcoin has regained the average by closing above it at month end, many of the hottest rallies in its brief but storied history have subsequently caught fire.
BITCOIN (BTC/USD). Monthly Chart with 20-month SMA.

While Bitcoin now fast approaches this critical moving average - a positive - we’re not expecting the bears to roll over without a fight in this area. Specifically, the area of concern is the monthly supply zone between 28,750 and 34,830. Several prior lows, the declining 20-month moving average, and the opening of the emotionally-charged bearish controlling candle of June 2022 all reside in this important supply zone. Expect turbulence and possible treachery in this area. Bitcoin could easily hit rough air soon.
THE TLDR
A Few Key Takeaways
When we consider the crossover stats against the wall of supply from June 2022 and before, our current general outlook remains neutral in the short-term (1 to 30 days), but bullish in the intermediate to long-term (180 - 365 days). Today’s key takeaways:
✔ The 100SMA > 365SMA crossover is historically bullish
✔ We do not expect the signal to maintain its current average trade of +1663%
✔ That said, even a fraction of the average trade would be impressive
✔ Historically, the signal delivers the best hypothetical gains between 1-2 years
✔ In the short-term, expect turbulence between 28,750 and 34,830
NONCE SENSE
50. Crypto-Skeptical Partygoers & the Wall of Worry
A dear friend just turned 50. In my experience, crossing the threshold of one of these whole round numbers can be both intimidating and exhilarating. On the one hand, there’s the realization that your first digit just climbed a full handle, and life’s Theta (i.e., time decay) ticks mercilessly toward expiration. On the other hand, with some mix of luck and appeasement of the Fates, the start of a new personal decade presents the opportunity to reassess, rebalance, and reinvent. And to throw a killer party, which is what my friend just did. Why do you care? In a room of talented artists, coders, and intellectuals, the few conversations I had in which crypto came up were met with moderate skepticism and a glass-half-empty attitude. Maybe I spoke with the “wrong people” or the sample set I was partying with reflected some special bias against digital assets. But this is arguably bullish. You either see the value of Bitcoin or you don’t. You understand the genius of Ethereum or you don’t. There’s very little middle ground. That is, unless crypto is ripping feverishly to new highs and attitudes suddenly get far more accommodating. In the spring of 2021, a lovely woman checking me out at the grocery told me about her Ripple position (her “retirement plan”). Some months later, in November 2021, two friends brought up crypto on a Zoom call, musing about whether they should finally buy in. Yes, you read that correctly… November 2021. While it’s sometimes painful to hear the skepticism or listen to deeply uninformed, often regurgitated opinions, let them stay skeptical. Like all assets, crypto must climb the age-old wall of worry. When these same people start throwing Bitcoin parties, that’s the time to worry.
peace_love_crypto-DB
IMPORTANT DISCLAIMER
The information presented and made available in this newsletter is intended for educational purposes only. THE INFORMATION IS NOT AND SHOULD NOT BE CONFUSED WITH INVESTMENT ADVICE AND DOES NOT ATTEMPT OR CLAIM TO BE A COMPLETE DESCRIPTION OF ANY SPECIFIC COINS, TOKENS OR MARKETS OF ANY KIND, BUT RATHER EDUCATIONAL EXAMPLES OF THE APPLICATION OF TECHNICAL ANALYSIS AND QUANTITATIVE ANALYSIS TO THE MARKET. This information has been presented and prepared without regard to any particular person's investment objectives, financial situation and particular needs because as individuals come from diverse backgrounds, with diverse objectives and financial situations. This information is of a general nature only so you should seek advice from your investment advisor or other financial professional as appropriate before taking any action. The opinions and analyses included herein are based on sources and data believed to be reliable and are presented in good faith, however no representation or warranty, expressed or implied is made as to their completeness or accuracy. It is imperative to understand your investment risks since all stock investments involve significant risk. The user of REKTelligence’s newsletters, podcasts, courses, coaching and other educational services agrees to indemnify and hold harmless REKTelligence LLC from and against any and all liabilities, expenses (including attorney's fees), and damages arising out of claims resulting from the use of this educational content. REKTelligence LLC is not a licensed investment advisor.
© 2023 REKTelligence LLC