


This Bitcoin MA Crossover is Bullish AF (and just days away from hitting)

TODAY’S STATS
We've got the stats for one of Bitcoin and Ether's most bullish (and soon to occur) moving average crossovers
While historical occurrences of long-term moving average crossovers will always be limited in number for a relatively new asset like Bitcoin, the 200ma > 365ma crossover stands out. What our query may lack in statistical significance, it makes up for with its stunning performance characteristics. Naturally, twenty years forward we’ll have a much better statistical picture of this particular moving average (MA) crossover, but in the meantime we’ll delve into the data we do have for both Bitcoin and Ether.
BITCOIN (BTC/USD). Daily Chart with pending 200ma and 365ma crossover.

Our first query is simple: how has Bitcoin performed historically when its widely watched 200-day moving average (200ma) crosses over (i.e., becomes greater than the value of) its 365-day moving average (365ma)? We’ll first look at a simple “sell one year later” scenario before looking at various holding times.
OUR BITCOIN QUERY'S SETUP CONDITIONS:

CONDITION_1: Bitcoin's 200ma crosses over its 365ma


ENTRY AND EXIT CONDITIONS:

1. ENTRY CONDITION: Enter long ("buy") at the open of the next daily candle
2. EXIT CONDITION: Exit ("sell") 1 year later
Here are the results using a 365-day (one year) hold:
BITCOIN (BTC/USD). Query Results for BTC with a 1-year Hold. 2011-Now.

The four historical occurrences have been profitable 3 of 4 times (75% win rate) with an average trade of +361.3% over a 1-year holding period. These trades occurred in July 2012 (about 4 months before the 1st Bitcoin halving), November 2015 (roughly 8 months before the 2nd halving), July 2019 (about 10 months before the 3rd halving), and most recently in August 2020 (just following the most recent halving). The sharp contrast between the best trade of +1100% and the worst trade of only -5.9% is rather tantalizing. Measured another way, the sum of gross hypothetical gains is over 247 times the sum of its gross losses, delivering the jaw-dropping Profit Factor of 247.7.
Now let’s look at Bitcoin’s results for Average Gain and Average Loss across various holding times ranging from 7-days to a year. Note that the Win % shows how many trades were profitable, hypothetically speaking.
BITCOIN (BTC/USD). Holding Time Results for 200ma>365ma Crossover. 2011-Now.

Over the short-term 7-day and 15-day hold times, this crossover has seen only success in Bitcoin, experiencing no losses though only modest hypothetical gains. Obviously, the 180-day and 365-day hold times stand out here for their outsized average gain and modest average loss.
As luck and correlation would have it, Ether appears poised to experience the same MA crossover as Bitcoin in the very near future. In fact, potentially sooner than Bitcoin. Let’s take a look…
ETHER (ETH/USD). Daily Chart with pending 200ma and 365ma crossover.

Our second query is equally simple: how has Ether performed historically when its widely watched 200-day moving average (200ma) crosses over (i.e., becomes greater than the value of) its 365-day moving average (365ma)? We’ll first look at a simple “sell one year later” scenario before looking at various holding times.
OUR ETHER QUERY'S SETUP CONDITIONS:

CONDITION_1: Ether's 200ma crosses over its 365ma


ENTRY AND EXIT CONDITIONS:

1. ENTRY CONDITION: Enter long ("buy") at the open of the next daily candle
2. EXIT CONDITION: Exit ("sell") 1 year later
Here are the results using a 365-day (one year) hold:
ETHER (ETH/USD). Query Results for ETH with a 1-year Hold. Inception-Now.
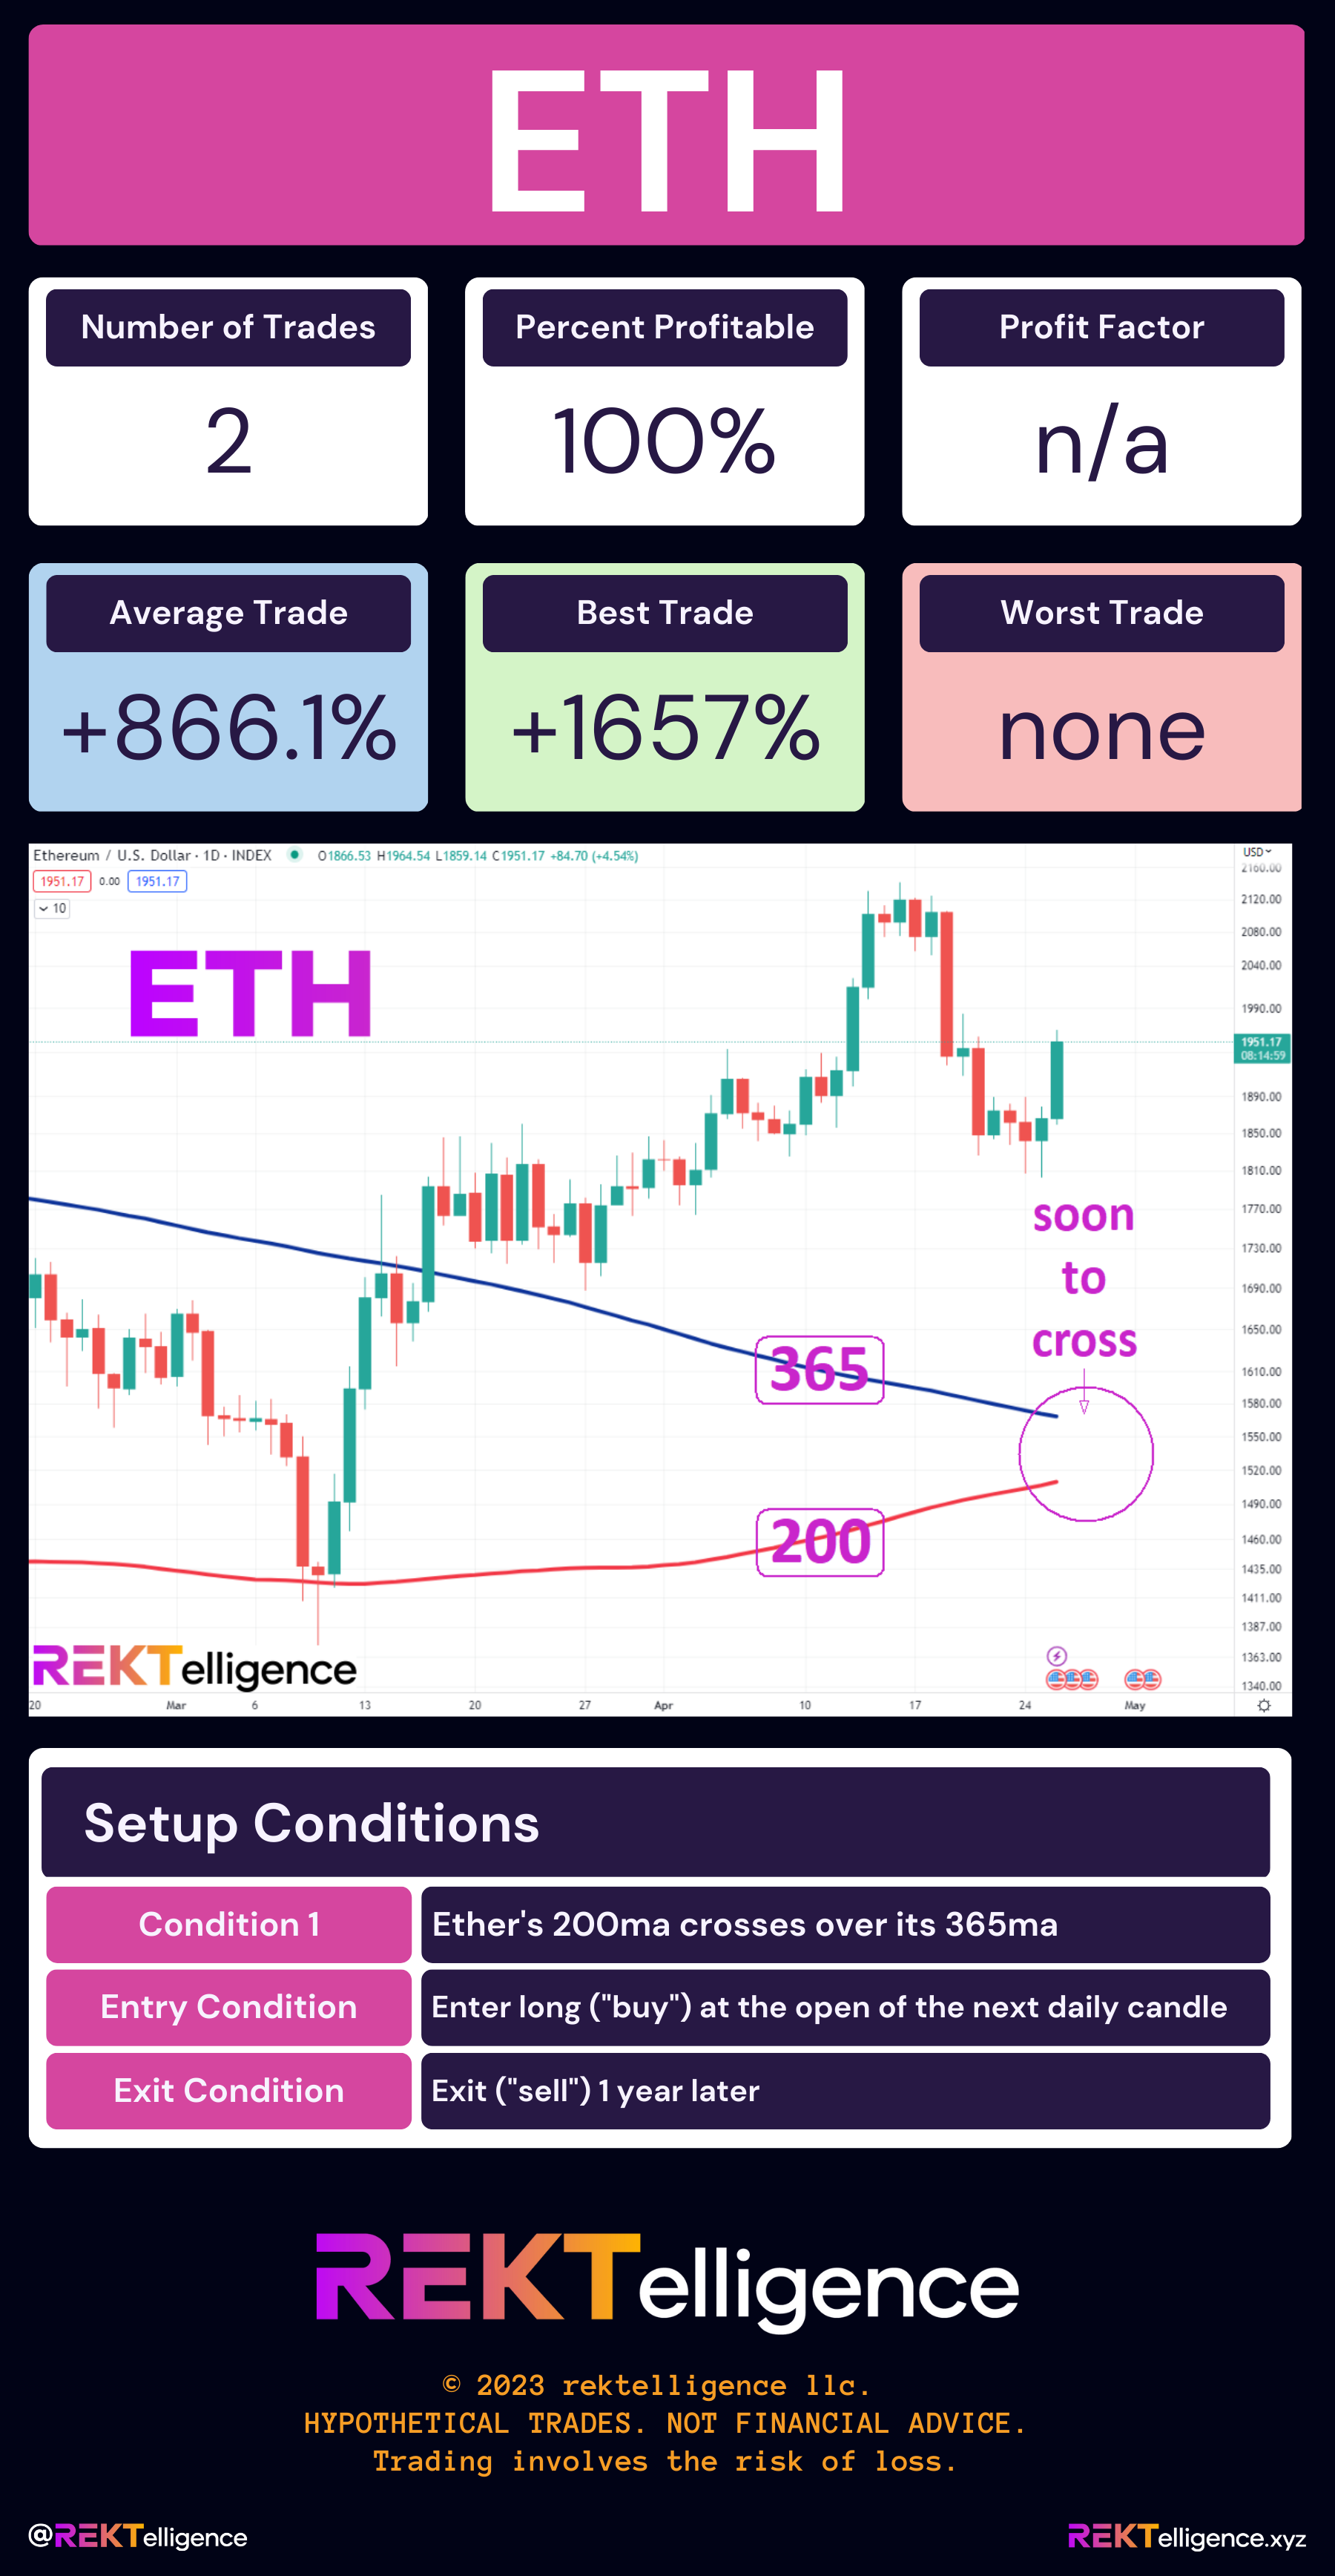
The two historical occurrences have been profitable both times (100% win rate) with an average trade of +866.1% with a 1-year holding period. Again, not statistically significant, but it’s all we have to examine at this time for this crossover.
Ether has delivered a hypothetical best trade of +1657% and an average trade of just over +866%. While generally speaking crypto returns have diminished over time, a small fraction of the average trade shown here would disappoint few traders on the next 200ma > 365ma crossover - something we expect to happen soon. We can never know the outcome of the next crossover (i.e., the future is unknowable). The seasoned trader understands that the very next trade could turn out to be the worst result on record. Or, for that matter, the best. Either way, beyond the stats revealed in today’s simple queries, risk management is crucial.
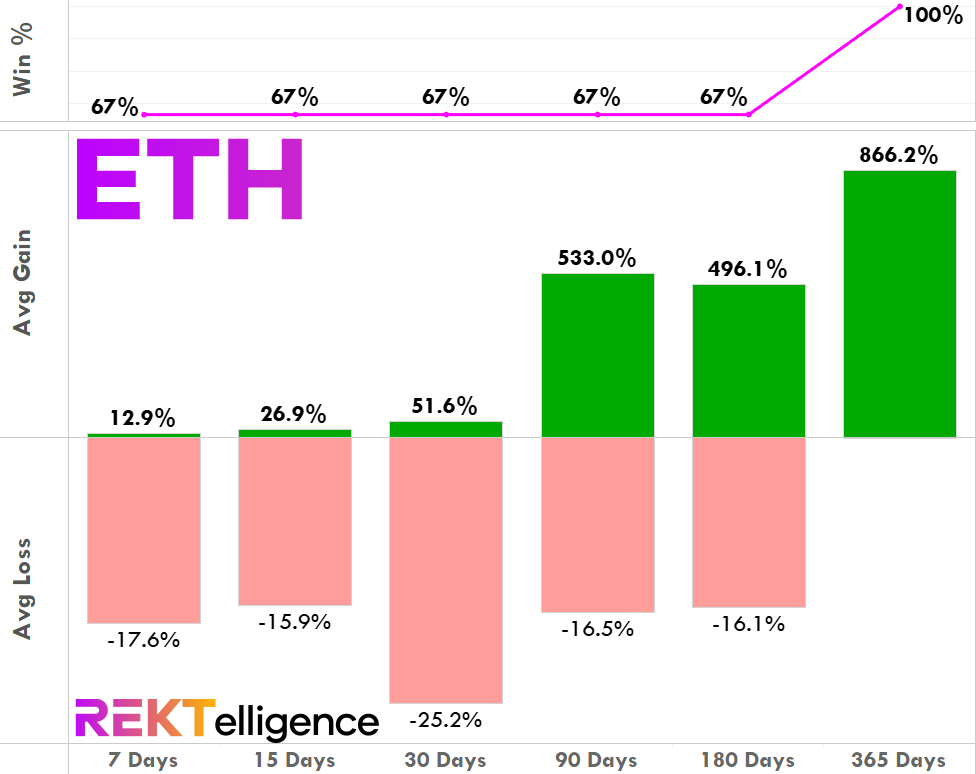
Lastly, a look at Ether holding times following the 200ma > 365ma crossover shows a steady Win % for most holding times and only arguably modest average losses no matter the hold time. Held for one year, as we discussed, historically there have been no hypothetical losses.
ETHER (ETH/USD). Holding Time Results for 200ma>365ma Crossover. Inception-Now.
THE TECHNICAL VIEW
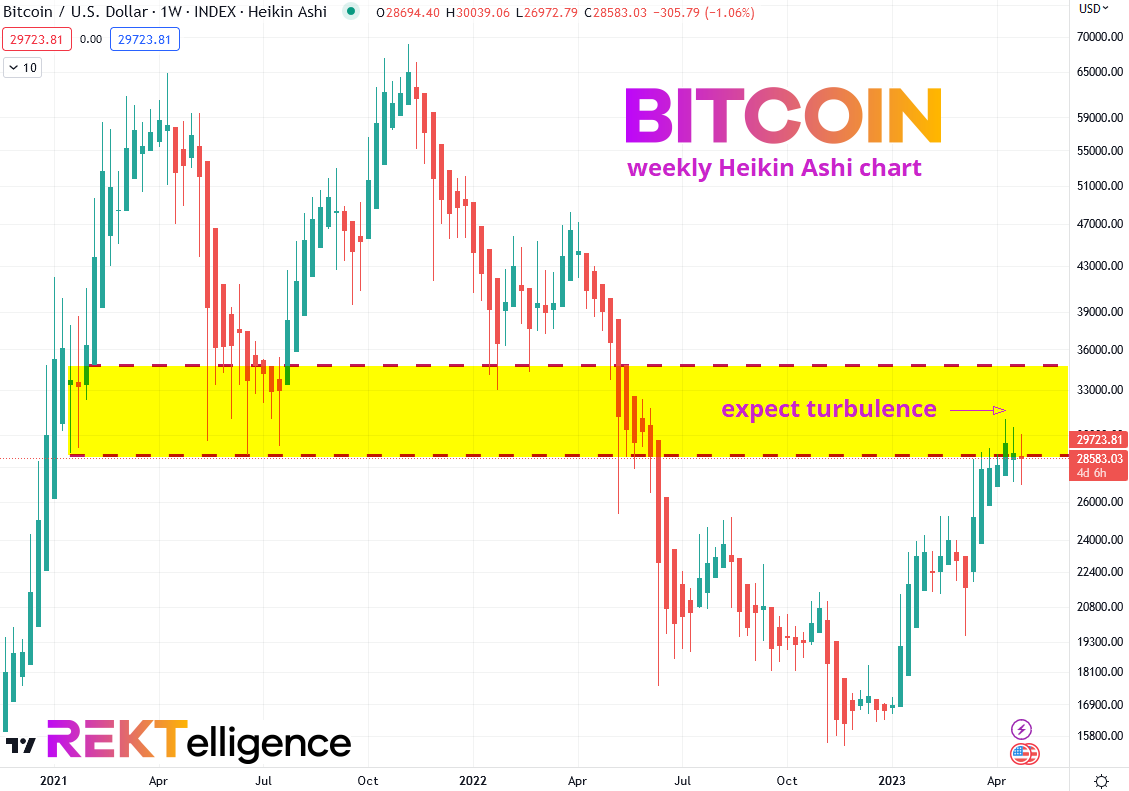
As Predicted, We Hit Rough Air. More Turbulence Likely Ahead.
The 28,750 to 34,800 area remains the intermediate-term concern. With significant prior price history (mostly swing lows from the past bull market) sitting just overhead, Bitcoin will likely remain stuck in this area for the foreseeable future, especially with the next halving so many months away and recession fears looming just beyond the horizon. The “Halving vs. Recession” debate is the central tension dominating Bitcoin at present. Throw in a healthy pinch of regulation speculation and you’ve got Ether’s central dilemma. The good news? The current wall of worry for crypto grows, and this may be just what the bulls need to climb over in the long-term.
BITCOIN (BTC/USD). Weekly Chart with Heikin Ashi candles.
THE TLDR
A Few Key Takeaways
✔ Historical occurrences of long-term MA crossovers will always be limited in number for a relatively new asset like Bitcoin
✔ The sharp contrast between Bitcoin's best hypothetical trade of +1100% and  worst trade of only -5.9% is tantalizing
✔ Ether may see its 200ma > 365ma crossover hit sooner than Bitcoin
✔ The “Halving vs. Recession” debate is currently the central tension dominating Bitcoin
peace_love_crypto-DB
IMPORTANT DISCLAIMER
The information presented and made available in this newsletter is intended for educational purposes only. THE INFORMATION IS NOT AND SHOULD NOT BE CONFUSED WITH INVESTMENT ADVICE AND DOES NOT ATTEMPT OR CLAIM TO BE A COMPLETE DESCRIPTION OF ANY SPECIFIC COINS, TOKENS OR MARKETS OF ANY KIND, BUT RATHER EDUCATIONAL EXAMPLES OF THE APPLICATION OF TECHNICAL ANALYSIS AND QUANTITATIVE ANALYSIS TO THE MARKET. This information has been presented and prepared without regard to any particular person's investment objectives, financial situation and particular needs because as individuals come from diverse backgrounds, with diverse objectives and financial situations. This information is of a general nature only so you should seek advice from your investment advisor or other financial professional as appropriate before taking any action. The opinions and analyses included herein are based on sources and data believed to be reliable and are presented in good faith, however no representation or warranty, expressed or implied is made as to their completeness or accuracy. It is imperative to understand your investment risks since all stock investments involve significant risk. The user of REKTelligence’s newsletters, podcasts, courses, coaching and other educational services agrees to indemnify and hold harmless REKTelligence LLC from and against any and all liabilities, expenses (including attorney's fees), and damages arising out of claims resulting from the use of this educational content. REKTelligence LLC is not a licensed investment advisor.
© 2023 REKTelligence LLC