


The Unlikely And Improbable
Four Ways of Looking at Last Week's Bitcoin Selloff

IN TODAY’S REPORT
What we cover: STATS EDITION. Four ways of defining Bitcoin’s recently tumultuous week. 90-day Exit. Dreaded Death Cross? Clustering and dependency.
TODAY’S STATS
Dreaded Death Cross?
A week after last Monday’s global growth scare selloff, I’m diving deeper into Bitcoin by looking at four ways of defining last week’s technical action, and what’s happened afterwards using a 90-day hold.
Does history suggest a bullish edge? Bearish? Neutral? We’ll get to that shortly.
Note that one of today’s queries takes on the dreaded “Death Cross”, meaning the ominously-named crossunder in which Bitcoin’s 50-day moving average closes below its 200-day moving average. Bitcoin just experienced this on Saturday 8/10/24.
Let’s get into it.
BITCOIN (BTC/USD). Daily Chart with Bitcoin “Death Cross”

To take a closer look at the future implications of last week’s action, I’ve run four tests over all of Bitcoin’s reliable history from 2011 to the present. The simpler the “query conditions” the more data points we get to consider (three conditions is the typical max, though occasionally I include more when required).
Today’s MULTIPLE query conditions with a 90-day hold:
//QUERY #1// "19% Drop in 7 Days"
CONDITION 1: Bitcoin closes lower >= 19% within 7 days
EXIT CONDITION: Exit ("sell") 90-days later

//QUERY #2// "BTC-VIX 160D Low"
CONDITION 1: BTCUSD/VIX closes at a 160-day low
EXIT CONDITION: Exit ("sell") 90-days later

//QUERY #3// "Close at 160D Low"
CONDITION 1: Bitcoin closes at a 160-day low
EXIT CONDITION: Exit ("sell") 90-days later

//QUERY #4// "Death Cross"
CONDITION 1: Bitcoin's 50MA closes < its 200MA
EXIT CONDITION: Exit ("sell") 90-days laterTo put the above pseudo-code into plain english, Bitcoin recently…
Dropped at least 19% in just 7 days
Closed at a 160-day low
Experienced a so-called “Death Cross”, and
Bitcoin (BTCUSD) denominated in Volatility Index (VIX) terms also just hit at least a 160-day low
Here are all the hypothetical trade results produced for these combined queries.
BITCOIN (BTC/USD). Today’s Queries: All Trades w/ 90-day Hold. 2011-Now.
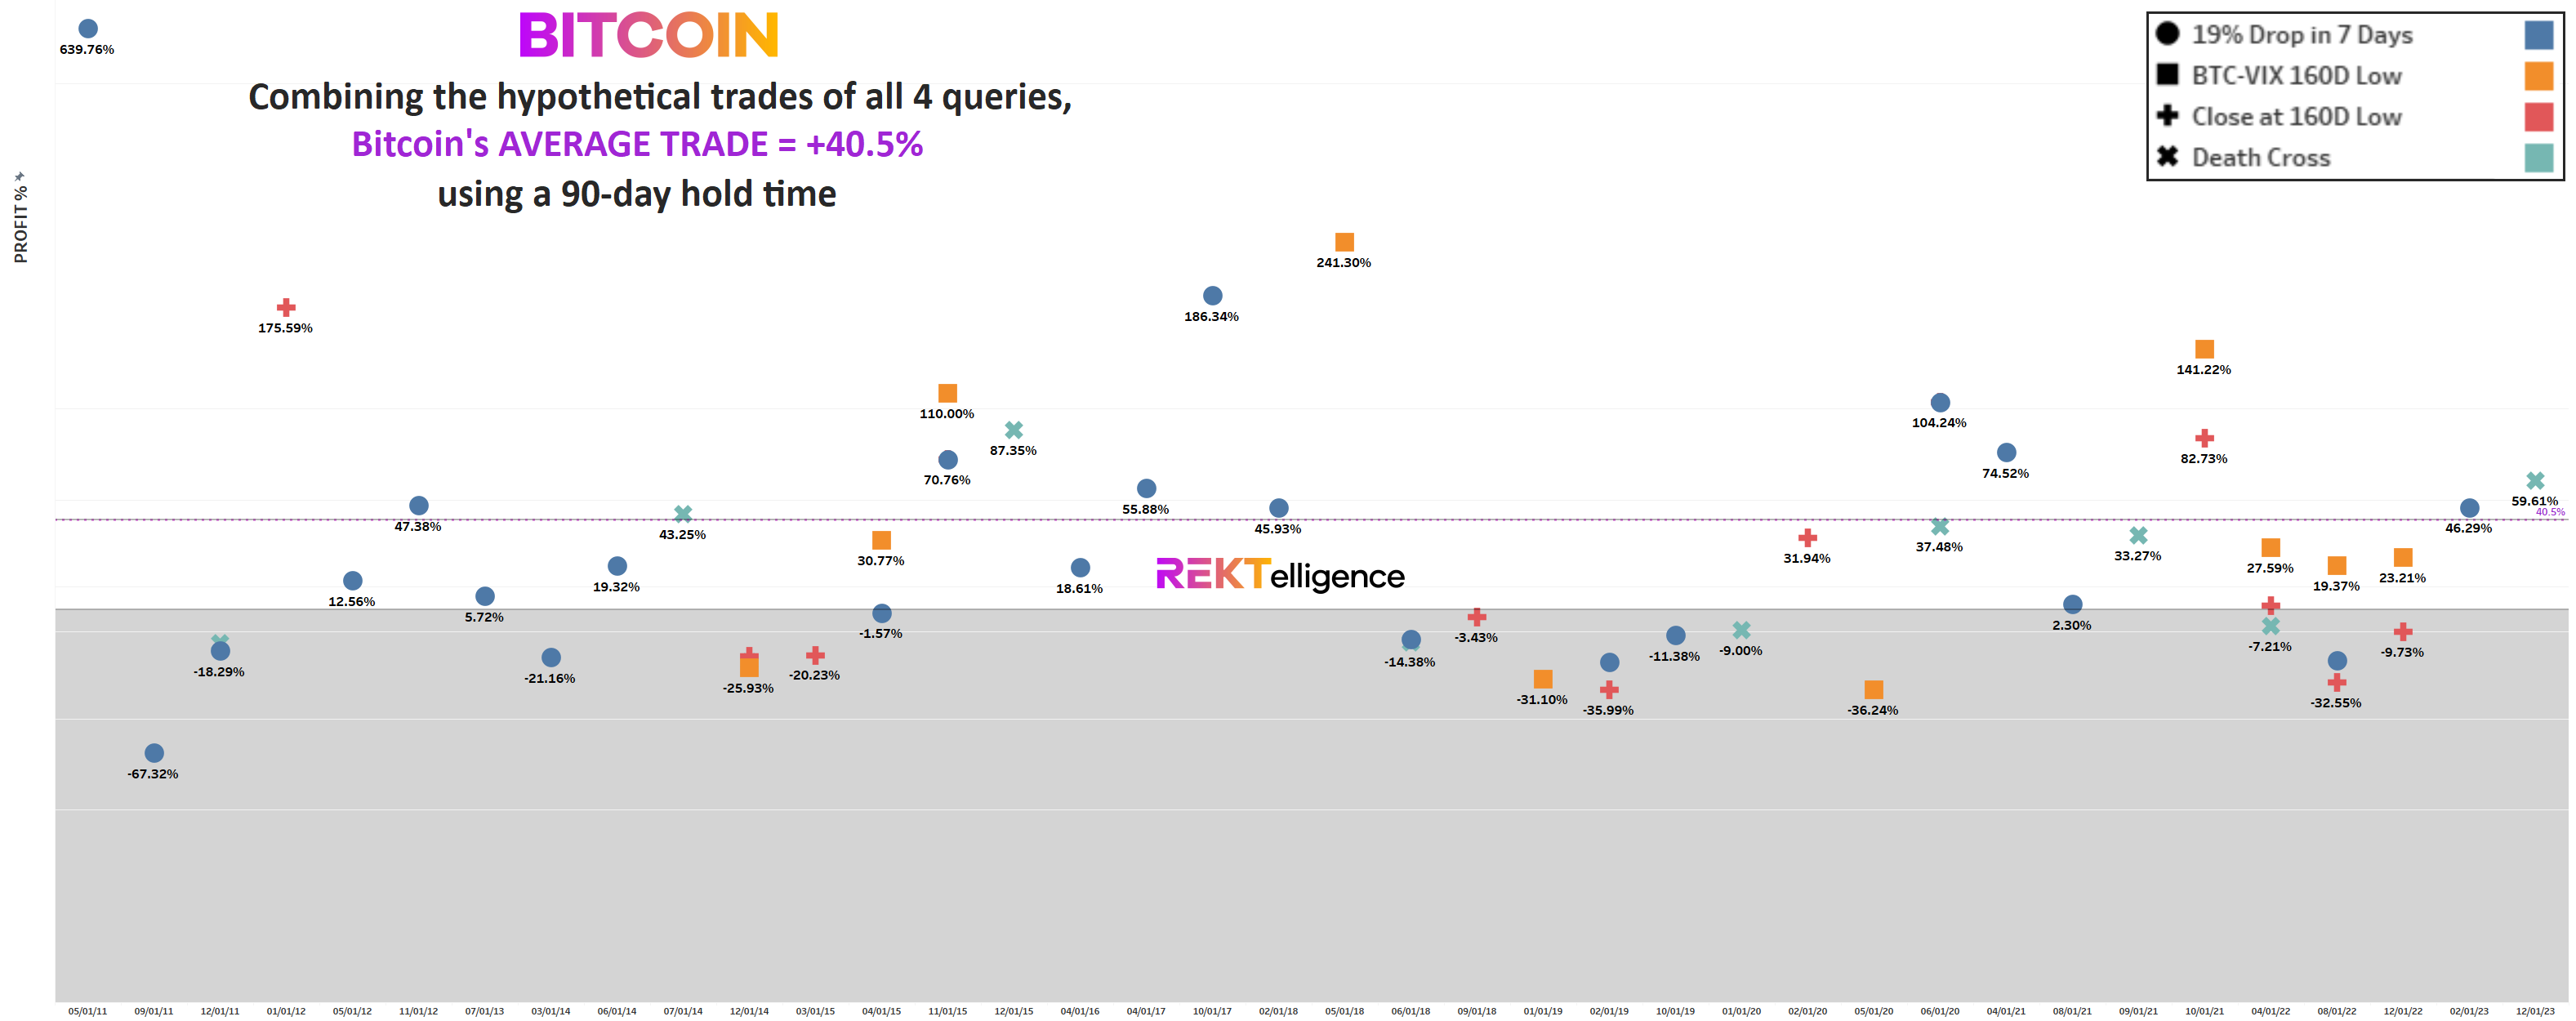
The largest gain under current conditions occurred in 2011 — the early outlier of +639.76% (“19% Drop in 7 Days”) — while the largest loss of -67.32% also occurred in 2011 and resulted from the same query. As long-time REKTelligence Report readers know, Bitcoin’s early history often produces the greatest magnitude data points and today is no exception.
Interestingly, the next largest loss was far lower at -36.24% (“BTC-VIX 160-D Low”), a relatively modest loss when considering this many combined trades.
Taken all together, the average trade result is +40.5% for all trades, a level which would put Bitcoin at 75,941.65 by early Novermber.
As last week’s report covered in detail, many of this year’s Bitcoin queries have routinely leaned bullish, but market action has mostly disappointed since March.
And such is the clustering nature of markets, in which gains and losses alike often show dependency, clustering together in ways that can either reward or utterly wreck a trader.
For now — and once again — we consider the bullish tilt of today’s report while focusing on avoiding getting rekt.
Can I handle a 67.32% decline from last Monday’s closing level?
It may be unlikely and improbable, but it’s a good question to ask.
Until next time…
peace_love_crypto-DB

IMPORTANT DISCLAIMER
The information presented and made available in this newsletter is intended for educational purposes only. THE INFORMATION IS NOT AND SHOULD NOT BE CONFUSED WITH INVESTMENT ADVICE AND DOES NOT ATTEMPT OR CLAIM TO BE A COMPLETE DESCRIPTION OF ANY SPECIFIC COINS, TOKENS OR MARKETS OF ANY KIND, BUT RATHER EDUCATIONAL EXAMPLES OF THE APPLICATION OF TECHNICAL ANALYSIS AND QUANTITATIVE ANALYSIS TO THE MARKET. This information has been presented and prepared without regard to any particular person's investment objectives, financial situation and particular needs because as individuals come from diverse backgrounds, with diverse objectives and financial situations. This information is of a general nature only so you should seek advice from your investment advisor or other financial professional as appropriate before taking any action. The opinions and analyses included herein are based on sources and data believed to be reliable and are presented in good faith, however no representation or warranty, expressed or implied is made as to their completeness or accuracy. It is imperative to understand your investment risks since all stock investments involve significant risk. The user of REKTelligence’s newsletters, podcasts, courses, coaching and other educational services agrees to indemnify and hold harmless REKTelligence LLC from and against any and all liabilities, expenses (including attorney's fees), and damages arising out of claims resulting from the use of this educational content. REKTelligence LLC is not a licensed investment advisor.
© 2024 REKTelligence LLC