The King Will Soon Awaken
IN TODAY’S REPORT
What we cover: Bitcoin’s daily ADX indicator falls to extreme low level. Comparison of current conditions to buy and hold.
TODAY’S STATS
Another Volatility Measure Flashes (Yet Another) Signal
Bitcoin’s current slumber belies a market state which is primed for explosive price action. Our last Report covered this in great detail, from Bitcoin’s extreme low range constriction, to the percentage of circulating supply that has not moved in at least a year hitting a new high, to its monthly ADX reading recently hitting a record low level — all showing parallels to 2015 right before a major rally.
In the trendless October 2015 market — with its monthly ADX reading at 19.58 — Bitcoin would soon explode from a monthly closing value of $316 to a high of $19,804 just over two years later, with arguably no significant drawdowns along the way. Bitcoin’s 62x blastoff to its late 2017 high began with little excitement and an utterly trendless market state following a brutal 2014 bear market. [REKTelligence Report, 7/31/23]
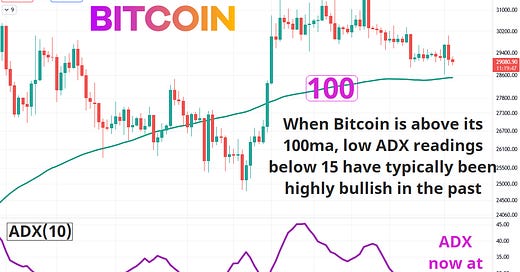
Today we look at Bitcoin’s daily ADX(10) reading which just hit an extreme low level below 15, and what the level suggests for price action going forward. We’ll examine all data and outcomes before comparing them to a simple buy and hold strategy.
BITCOIN (BTC/USD). Daily Chart with Average Directional Index (10) and 100ma.
Today’s query conditions are as follows:
QUERY SETUP CONDITIONS:

CONDITION 1: Bitcoin's ADX(10) <= 15
CONDITION 2: Bitcoin's is above its 100-day moving average (100ma)


ENTRY AND EXIT CONDITIONS:

1. ENTRY CONDITION: Enter long ("buy") at the open of the next daily candle
2. EXIT CONDITION: Exit ("sell") N-days later
The average trade comparison below reflects two different approaches:
Today’s Conditions: Buy Bitcoin when its ADX(10) is less than or equal to 15 while above its 100ma, then sell “N days later”
Buy and Hold: Buy Bitcoin if it closes higher than 0.00000001, then sell “N days later”
Our goal is to see whether the narrow basing action we’re seeing now is bullish or bearish in an absolute sense, as well as how it stacks up relative to a simple “buy and hold” strategy.
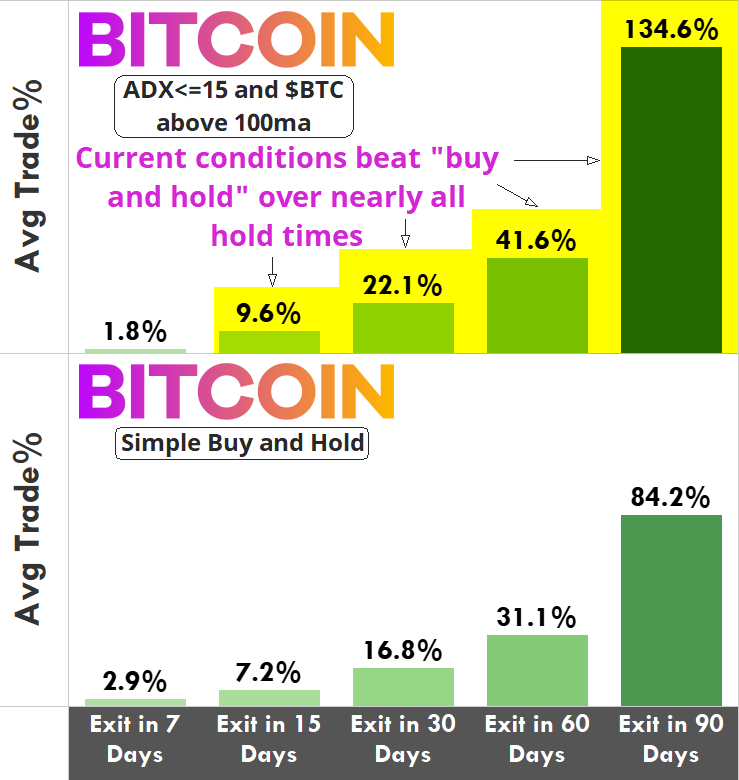
BITCOIN (BTC/USD). Average Trade Comparison, Current Conditions vs “Buy and Hold”
Looking at hypothetical average trade results, a simple buy and hold approach has only beaten current conditions over a 7-day hold time, slightly edging out current conditions’ +1.8% average trade with a +2.9% average trade.
Beyond the 7-day hold, Bitcoin’s current low ADX and moving average conditions have historically beaten buy and hold over every other short-term and intermediate-term hold time, suggesting that Bitcoin is now poised to wake up and outperform.
For another perspective, let’s look at the Win % for each approach. Win % is short-hand for winning percentage, also known as percent profitable or win rate.
BITCOIN (BTC/USD). Win % Comparison, Current Conditions vs “Buy and Hold
Here we see that Bitcoin’s current setup has a higher winning percentage than a buy and hold the majority of the time, particularly over the 15-day hold time with current conditions profitable 79% of the time.
When Bitcoin is above its 100ma, low ADX readings below 15 have typically been highly bullish and beaten buy and hold. When combined with the monthly studies we featured in our 7/31/23 report, Bitcoin’s eerily quiet daily price action and low ADX look explosive. Don’t let Bitcoin’s slumber fool you — the king will soon awaken.
THE TLDR
A Few Key Takeaways
✔ Beyond the 7-day hold, Bitcoin’s current low ADX and moving average conditions has historically beaten buy and hold over every other short-term and intermediate-term hold time
✔ Bitcoin’s current setup has a higher winning percentage than a buy and hold the majority of the time, particularly over the 15-day hold time with current conditions profitable 79% of the time
✔ When combined with the monthly studies we featured in our 7/31/23 report, Bitcoin’s eerily quiet daily price action and low ADX look explosive
peace_love_crypto-DB
IMPORTANT DISCLAIMER
The information presented and made available in this newsletter is intended for educational purposes only. THE INFORMATION IS NOT AND SHOULD NOT BE CONFUSED WITH INVESTMENT ADVICE AND DOES NOT ATTEMPT OR CLAIM TO BE A COMPLETE DESCRIPTION OF ANY SPECIFIC COINS, TOKENS OR MARKETS OF ANY KIND, BUT RATHER EDUCATIONAL EXAMPLES OF THE APPLICATION OF TECHNICAL ANALYSIS AND QUANTITATIVE ANALYSIS TO THE MARKET. This information has been presented and prepared without regard to any particular person's investment objectives, financial situation and particular needs because as individuals come from diverse backgrounds, with diverse objectives and financial situations. This information is of a general nature only so you should seek advice from your investment advisor or other financial professional as appropriate before taking any action. The opinions and analyses included herein are based on sources and data believed to be reliable and are presented in good faith, however no representation or warranty, expressed or implied is made as to their completeness or accuracy. It is imperative to understand your investment risks since all stock investments involve significant risk. The user of REKTelligence’s newsletters, podcasts, courses, coaching and other educational services agrees to indemnify and hold harmless REKTelligence LLC from and against any and all liabilities, expenses (including attorney's fees), and damages arising out of claims resulting from the use of this educational content. REKTelligence LLC is not a licensed investment advisor.
© 2023 REKTelligence LLC


