IN TODAY’S REPORT
What we cover: Defining current ETH conditions. Hypothetical trades from inception. Last five years. New onramps and the coming flood.
TODAY’S STATS
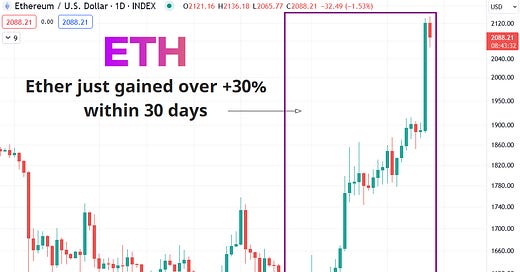
30% In 30 Days
Ether just broke out of a months-long Bull Flag consolidation pattern on massively expanded range yesterday — a major technical event sparked by news of Blackrock’s filing for a spot Ethereum ETF in Delaware. The upshot? Not just a big day, but a huge month as ETH just gained over 30% within 30 days.
While shouts of bring it! and LFG! come to mind, let’s take a more rational approach to this notable recent upside by quantifying the price action. Can we expect a pullback or pause? Another small push higher or maybe monster leg up?
Let’s get into it…
ETHEREUM (ETH/USD). Daily Chart with Today’s Conditions.
First, to take a closer look at the future implications of the current setup, we need to run a simple test over all of Ethereum’s history from inception to the present. Our “query conditions” represent a basic definition of the technical state of ETHUSD. The simpler the conditions the more data points we get to consider (three conditions is our typical maximum).
First, our simple query conditions with a 60-day hold:
ETHEREUM SETUP CONDITIONS

CONDITION 1: Ether gains >= +30%
CONDITION 2: Ether's gains occur within 30 days or less


ENTRY AND EXIT CONDITIONS:

1. ENTRY CONDITION: Enter long ("buy") at the open of the next candle
2. EXIT CONDITION: Exit ("sell") 60-days laterThis setup seems extraordinary at first, a rare technical event which should have few data points. But alas, this view would be a mistake. Ethereum has experienced these conditions 24 times since its inception in 2015, roughly three times per year on average — hardly a rare event. On the chart below, all hypothetical trades since inception shown below.
ETHEREUM (ETH/USD). Today’s Conditions: All Trades w/ 60-day Hold. Inception-Now.
While not every ETHUSD trades scatter shows such a preponderance of massive gains in its early years, many do and this chart is certainly one of them. In short, the majority of its massive gains occurred by the end of 2017 with far fewer to show since.
While the average trade of +76.38% using a 60-day hold is impressive, we need a more conservative perspective based on recent trading. For this, we move to trades which have occurred from 2019 to the present, a roughly five year window.
ETHEREUM (ETH/USD). All Trades w/ 60-day Hold. 2019-Now.
Using more recent data, Ether’s average trade comes in much lower at +14.71%. While this data suggests to expect less of ETH in the next 60 days than we’ve just experienced, the win rate is a solid 58.3% and the majority of its losses are under -10%.
Ether’s next couple of months may only deliver modest upside on average, but the real takeaways are very possibly somewhere in between the two scatter plots. Conservatively, expectations should arguably be modest for the foreseeable future. On the other hand, the TradFi onramps into crypto which are currently being constructed, negotiated and soon approved, could easily propel Ether to test its 2021 highs on a flood of TradFi assets under management finally flowing freely into Bitcoin and (inevitably) Ethereum.
With future expectations for stocks diminished in Shiller P/E terms due to rich valuations, and crypto-embracing millennials about to inherit enormous wealth in the next decade plus, the coming flood may turn out to be a tsunami.
Will you be ready?
peace_love_crypto-DB
IMPORTANT DISCLAIMER
The information presented and made available in this newsletter is intended for educational purposes only. THE INFORMATION IS NOT AND SHOULD NOT BE CONFUSED WITH INVESTMENT ADVICE AND DOES NOT ATTEMPT OR CLAIM TO BE A COMPLETE DESCRIPTION OF ANY SPECIFIC COINS, TOKENS OR MARKETS OF ANY KIND, BUT RATHER EDUCATIONAL EXAMPLES OF THE APPLICATION OF TECHNICAL ANALYSIS AND QUANTITATIVE ANALYSIS TO THE MARKET. This information has been presented and prepared without regard to any particular person's investment objectives, financial situation and particular needs because as individuals come from diverse backgrounds, with diverse objectives and financial situations. This information is of a general nature only so you should seek advice from your investment advisor or other financial professional as appropriate before taking any action. The opinions and analyses included herein are based on sources and data believed to be reliable and are presented in good faith, however no representation or warranty, expressed or implied is made as to their completeness or accuracy. It is imperative to understand your investment risks since all stock investments involve significant risk. The user of REKTelligence’s newsletters, podcasts, courses, coaching and other educational services agrees to indemnify and hold harmless REKTelligence LLC from and against any and all liabilities, expenses (including attorney's fees), and damages arising out of claims resulting from the use of this educational content. REKTelligence LLC is not a licensed investment advisor.
© 2023 REKTelligence LLC


