

The 20/200 Collision
Today's EDGE REPORT quantifies Bitcoin's potential 20/200 crossover and the implications for the king crypto

Hey Trader,
Welcome to my latest EDGE REPORT in which I quantify current market opportunities and examine their trade potential.
I’m on the road, so no video report today — just lots of quant analysis & charts below!
The Collision Around the Corner
Bitcoin’s 20-day simple moving average closed below its 200sma on November 4, 2025, with Bitcoin itself ending up at 101,507.
As I write this update, Bitcoin is roughly 20% lower.
If you’ve been reading and/or listening to lots of analysis from the Bitcoin community lately like I have, you’ve probably noticed how many Bitcoin advocates have praised the king crypto’s ability to rally in the face of the Middle East war, higher energy prices, and a glamorous stock market full of AI exuberance.
On the heels of this much-lauded rally, Bitcoin’s 20sma and 200sma may soon clash, and potentially set up a crossover.
This is effectively a collision of the short-term trend (up) and intermediate/long-term trend (down).
The upshot? I’ve analyzed every 20sma/200sma crossover from 2011 to the present. Analysis first, takeaways at the end.
Results | Fading the Crossunder
Setup Condition: Bitcoin’s 20ma closes < its 200ma
Entry: Sell market on close (research-style entry)
Exit: Buy to close if Bitcoin’s 20ma closes > its 200ma
Dates: 2011-01-01 to 2026-05-13 (present)
Sizing: 75% of Equity (allows for short logic to lose but keep trading, as you’ll see)
Costs: None as this is not about a trading approach but rather Bitcoin’s price behavior
Using Strategy Analyzer — an app which takes TradingView’s output and provides institutional-grade analytics — we can that there’s no edge here whatsoever.
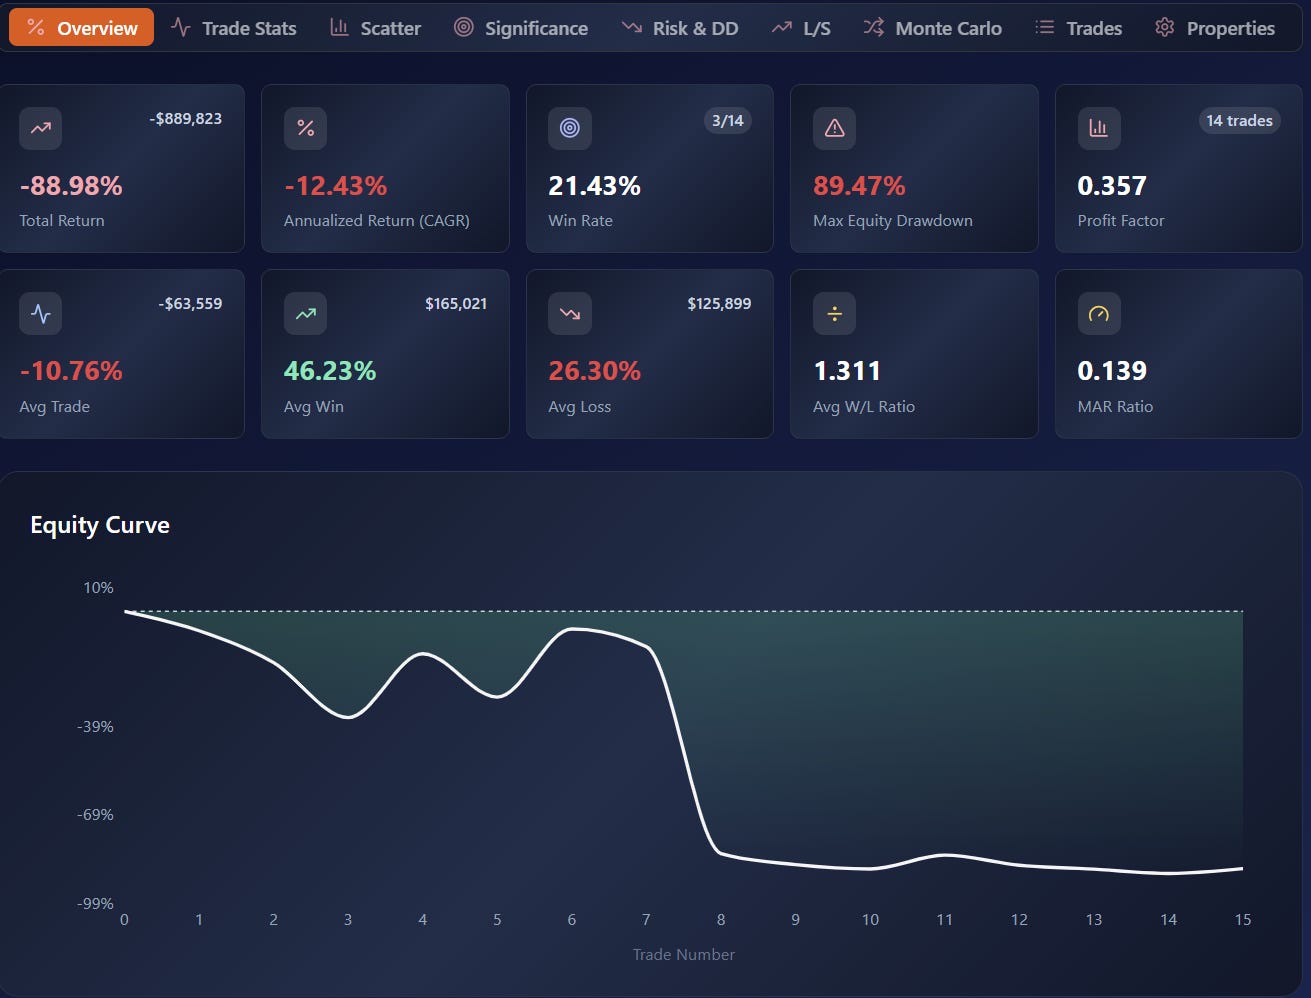
The results are simply awful. While it’s no surprise that an asset which has performed as well as Bitcoin has since its 2009 inception sucks on the short side, the hypothetical performance is worse than I imagined it would be.
Hit Rate: 21.43%
Instances: 14
Total Return: -88.98%
Annualized Return: -12.43%
Profit Factor: 0.357
These metrics speak for themselves. Let’s move to the long side.
Results | Buying the Crossover
Setup Condition: Bitcoin’s 20ma closes > its 200ma
Entry: Buy market on close (research-style entry)
Exit: Sell if Bitcoin’s 20ma closes < its 200ma
Dates: 2011-01-01 to 2026-05-13 (present)
Sizing: 75% of Equity
Costs: None as this is not about a trading approach but rather Bitcoin’s price behavior
While this simple logic has no risk control element, that’s not the point. The historical stats provide context for what may soon trigger — the 20ma’s potential cross above the 200ma.
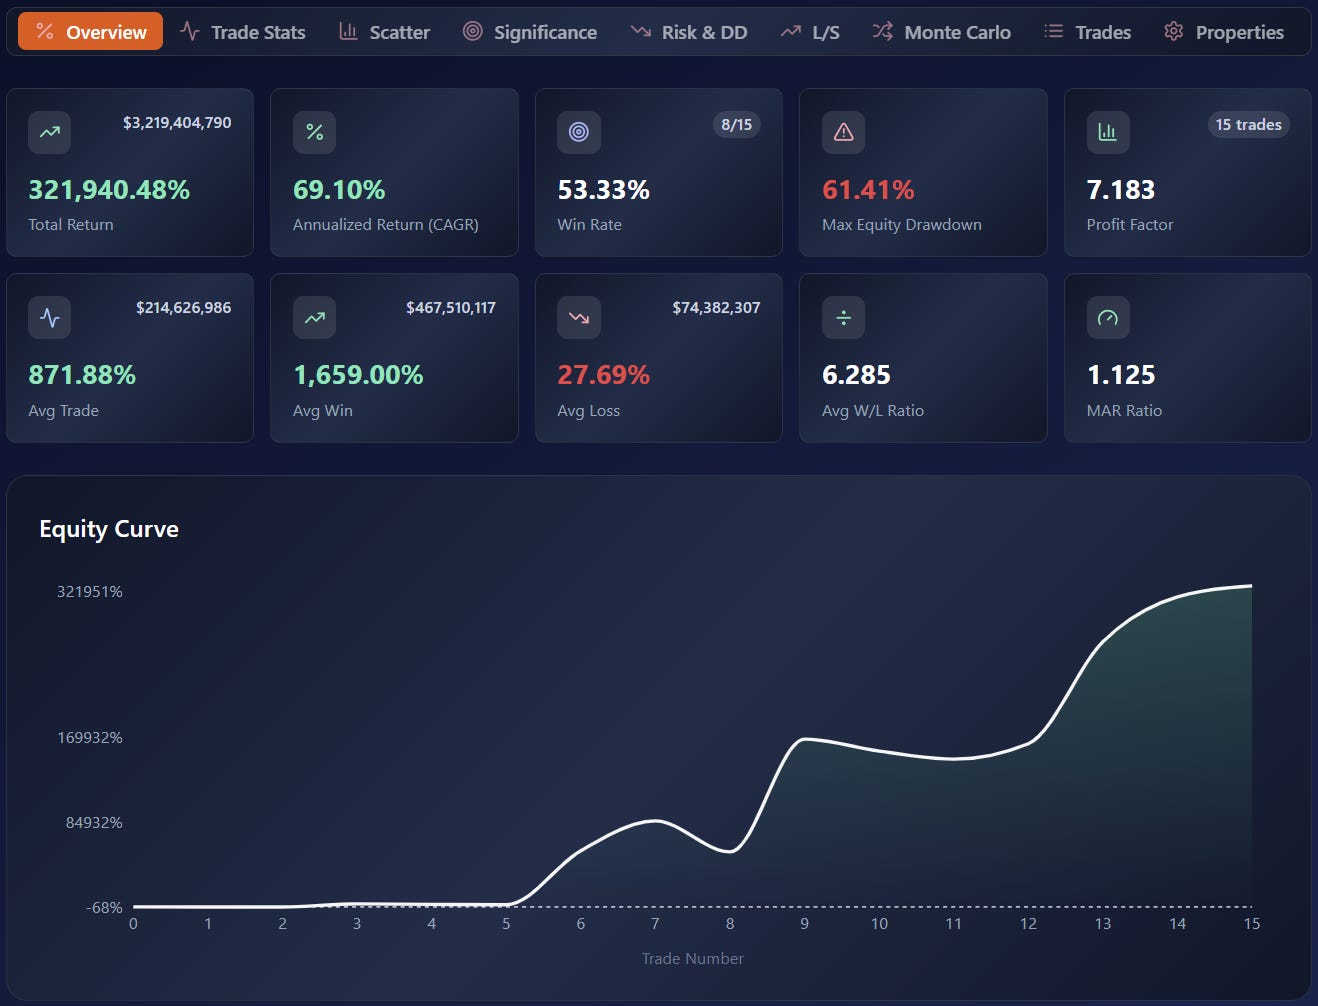
2011 to Present
Hit Rate: 53.33%
Instances: 15
Total Return: 321,940%
Annualized Return: 69.10%
Profit Factor: 7.183
Just north of a coin flip, the hit rate is not highly reliable. It’s just as easy for the next crossover to win as it is to lose. All other stats are noteworthy, however, even in the face of clearly limited instances.
Now let’s restrict this to 2017 to the present, eliminating the early years full of outliers.
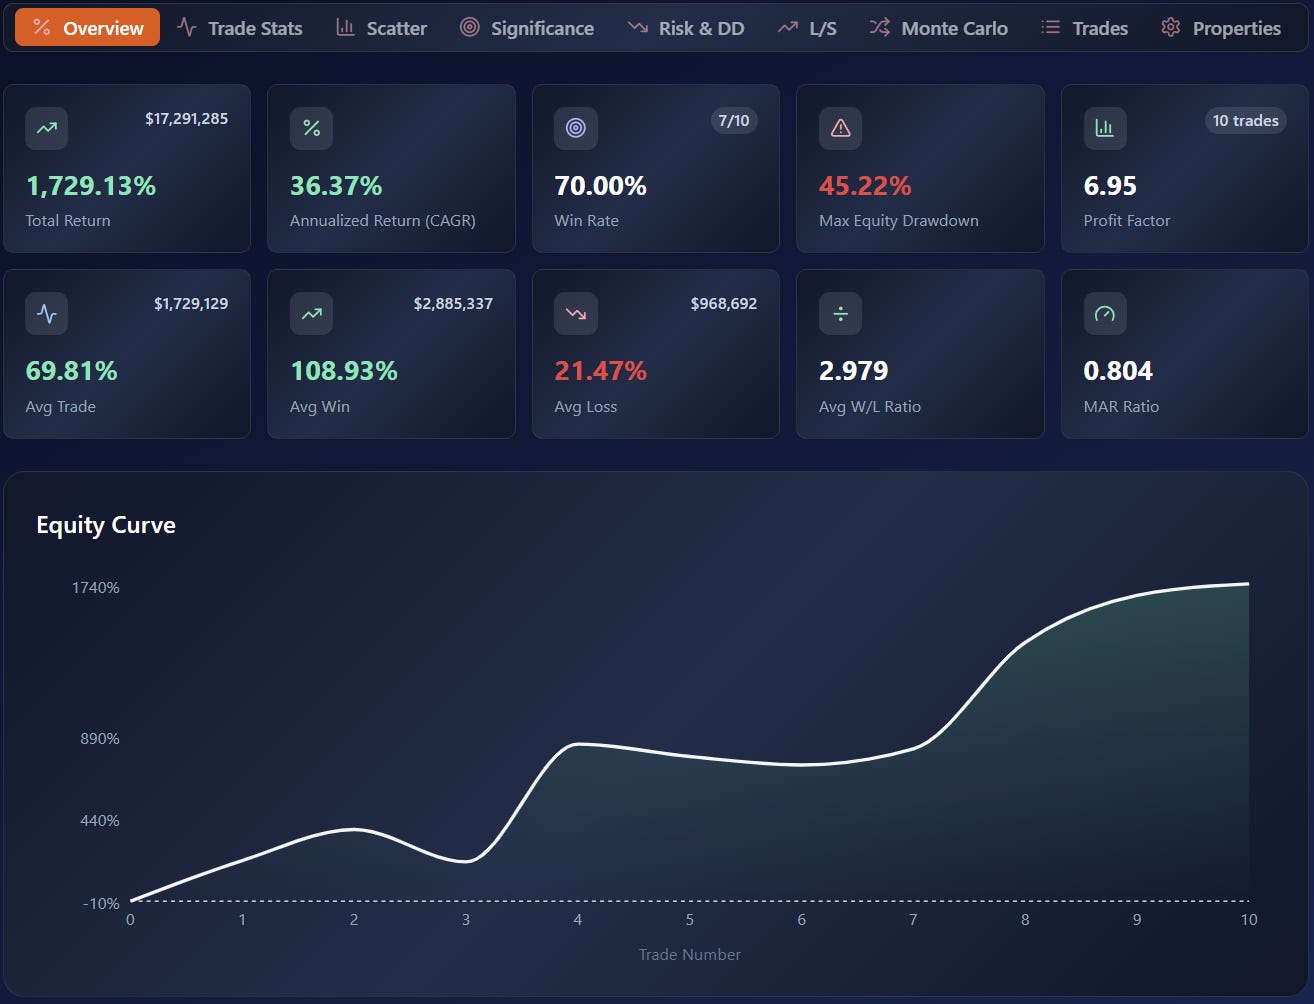
2017 to Present
Hit Rate: 70.00%
Instances: 10
Total Return: 1729.13%
Annualized Return: 36.37%
Profit Factor: 6.95
These stats remain compelling, even at only 10 instances.
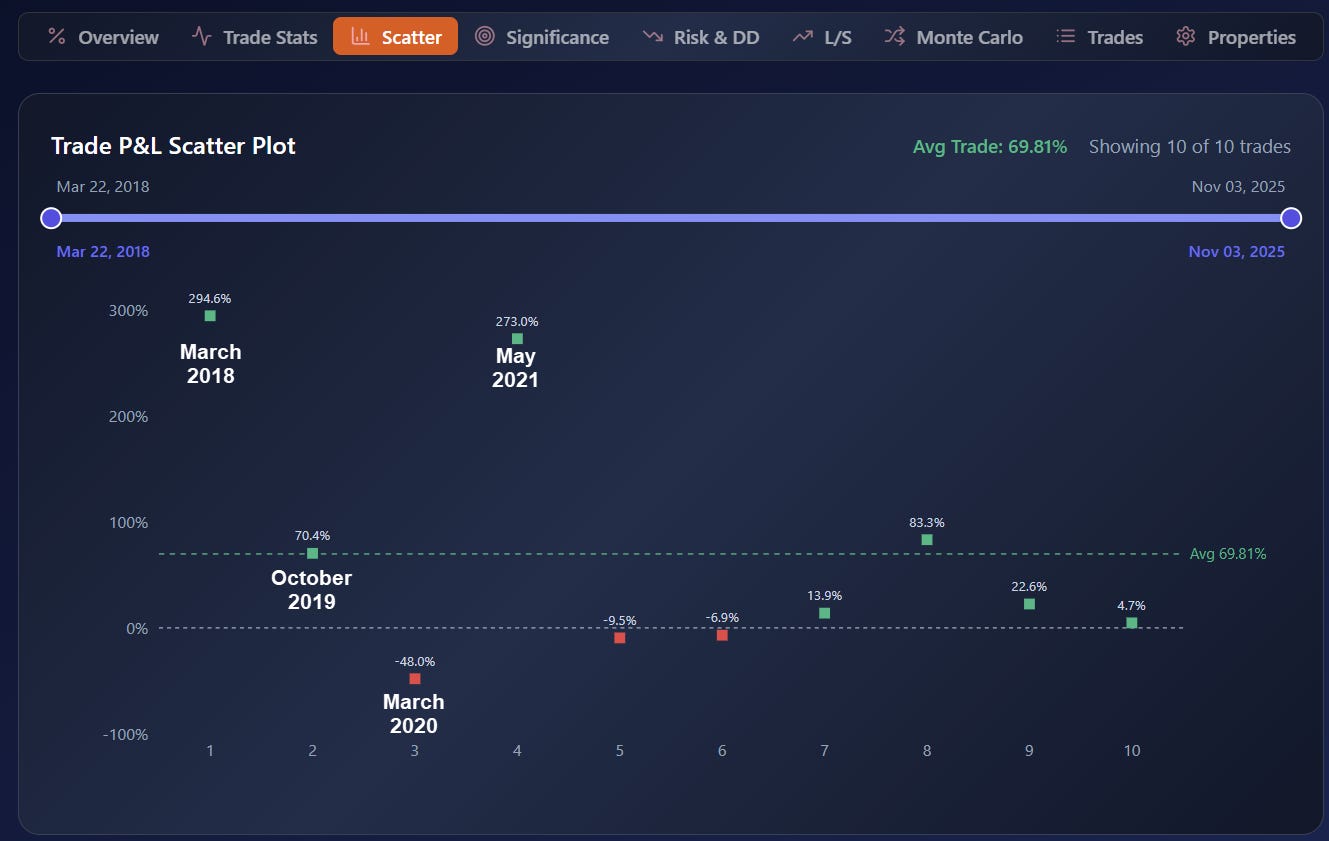
In this Scatter plot it’s the early trades which are of most interest.
The worst data point occurred during early COVID, right before risk assets turned RISK ON again and Bitcoin rocketed to a new ATH.
My Crypto Trader’s Edge Course is now live — and the initial cohort is limited to 50 spots. If you’ve been waiting to build a systematic edge in crypto, this is it. Learn more at the link below:
If you haven’t yet subscribed, sign up now before the paywall goes up later this year. I’ll be giving serious discounts to all early subscribers when that time arrives!
REKTelligence Takeaways
Bitcoin has arguably already stalled at its falling 200-day moving average.
It also remains pinched between its short-term recovery trend (rising 20ma) and its current intermediate-term/long-term malaise (falling 200ma).
This is a technical stalemate which will not persist for much longer.
The scatter plot above shows that volatility has been more subdued since 2023.
There are many variables behind this more muted phase, from the continued maturation of the asset class, institutionalization, and no retail-driven alt season last cycle just to name a few.
The odds of a consolidation (including some back-pedaling) for Bitcoin appear roughly the same as for the larger historical Crossover hit rate: ~50%.
That said, a potential expanded range breakout in concert with the 20ma closing > the 200ma may signal that Bitcoin is ready to retake the psychologically key $100,000 level in the coming weeks to few months.
The odds may be a coin flip, but the payoff is asymmetrically bullish and compelling.
Before I sign off, a quick note…
I’ve had the great pleasure recently of working 1-on-1 with a small cohort of serious traders. I’ve been at this for over 30 years now, and have been amazed at the creativity, diligence, and differentiated approaches some newer traders have been pursuing.
The common thread? Raw talent meeting a rigorous process for the first time. If you've got the former and want help building the latter, I have a few coaching spots open. Details below.
Cheers from the Caribbean,
Dave
David Bush
Lead Quant
Trading From Paradise LLC
tradingfromparadise.com
Trade Smart. Live Well. 🌴
🌐 Website: https://www.tradingfromparadise.com/
📬 Substack: https://rektelligence.substack.com
𝕏 Twitter / X: https://x.com/REKTelligence
💼 LinkedIn: https://www.linkedin.com/in/davidtbush/
▶️ YouTube: https://www.youtube.com/@REKTelligenceReport
🦋 Bluesky: https://bsky.app/profile/rektelligence.bsky.social
IMPORTANT DISCLAIMER
The information presented and made available in this newsletter is intended for educational purposes only. THE INFORMATION IS NOT AND SHOULD NOT BE CONFUSED WITH INVESTMENT ADVICE AND DOES NOT ATTEMPT OR CLAIM TO BE A COMPLETE DESCRIPTION OF ANY SPECIFIC COINS, TOKENS OR MARKETS OF ANY KIND, BUT RATHER EDUCATIONAL EXAMPLES OF THE APPLICATION OF TECHNICAL ANALYSIS AND QUANTITATIVE ANALYSIS TO THE MARKET. This information has been presented and prepared without regard to any particular person’s investment objectives, financial situation and particular needs because as individuals come from diverse backgrounds, with diverse objectives and financial situations. This information is of a general nature only so you should seek advice from your investment advisor or other financial professional as appropriate before taking any action. The opinions and analyses included herein are based on sources and data believed to be reliable and are presented in good faith, however no representation or warranty, expressed or implied is made as to their completeness or accuracy. It is imperative to understand your investment risks since all stock investments involve significant risk. The user of REKTelligence and/or Trading From Paradise’s newsletters, podcasts, courses, coaching and other educational services agrees to indemnify and hold harmless Trading From Paradise LLC from and against any and all liabilities, expenses (including attorney’s fees), and damages arising out of claims resulting from the use of this educational content. Trading From Paradise LLC is not a licensed investment advisor.
© 2026 Trading From Paradise LLC