IN TODAY’S REPORT
What we cover: TECHNICAL ANALYSIS Edition. Keeping it simple. Bitcoin weekly time correction. Sentiment reset. The balance of ETH HODLers climbs.
Bad News & More Bad News
The Crypto Fear & Greed Index recently fell back into the fear range, its extreme greed readings from March now a distant memory. Bitcoin just fell to an over 50-day closing low, shedding -4.59% a week ago on the news that the early and oft-hacked Mt. Gox exchange would begin distributing coins to its victims of a decade ago starting this month. Don’t forget about Germany’s roughly $3B in Bitcoin seizures which will be sold off in the coming weeks.
Lately it’s bad news and more bad news. Even the exciting speculation that the spot Ethereum ETFs will go live soon hasn’t been able to ignite the crypto market of late.
In this Technical Analysis Edition, we’ll keep it quite simple, looking at two charts which tell a simple story. A simple story which needs telling, in our view.
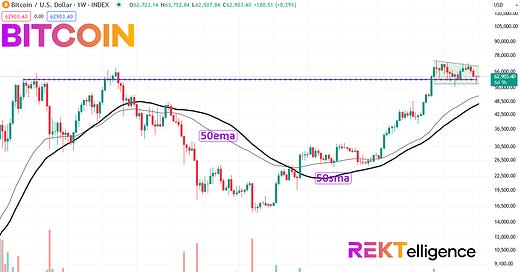
BITCOIN (BTCUSD). Weekly Chart w/ 50-wk simple ma & 50-wk exponential ma.
Markets correct either through price or through time. Despite the torrent of bad news in recent days, Bitcoin continues its time correction, moving relatively sideways within a range established between the March 13th high close and the May 1st low close. Yes, it’s Bitcoin, so “sideways” in this context involves a roughly 20% top to bottom price range which can upset the stomachs of all those new to the king crypto.
Shown on the weekly, this range takes place at or slightly above the Spring and Fall highs of the last bull cycle in 2021. While there’s no guarantee that Bitcoin can’t fall below its May 1st low and correct more meaningfully through price rather than through time, the current technical behavior appears constructive and warranted following last year’s +155% advance and a phenomenal Q1 in 2024.
The deteriorating sentiment evidenced by the Crypto Fear & Greed Index is the type of reading that experienced traders and investors actually crave. More fear among the poorly positioned, weak hands suggests that a shakeout and reset is well under way.
TAKEAWAY: Significantly more patience may be required, but Bitcoin's technicals remain bullish when viewed from the right perspective, with its weekly uptrend still firmly intact.ETHEREUM Balance of Assets Belonging to HODLers. Weekly Chart (IntoTheBlock Data).
While Bitcoin’s “Balance of Assets Belonging to HODLers” chart shows a decline from its late 2023 levels due to the significant amount of long-held coins suddenly shifting from Grayscale’s newly trading high fee ETF into lower fee ETFs from Blackrock and other providers — a dynamic not tied to market cycle but to the advent of new Wall Street investment vehicles — Ethereum’s “Balance of Assets Belonging to HODLers” remains in a fierce uptrend.
What this indicates is that the balance of assets held by ETH HODLers — those not moving their coins for a year or more — continues to climb.
This is significant, because as past crypto bull cycles have unfolded, the more price advances into uncharted territory, the more HODLers move their coins. In other words, HODLers cease to be HODLers, moving and selling some or all of their holdings. This is simply not happening. In fact, quite the opposite.
TAKEAWAY: While Bitcoin’s “Balance of Assets Belonging to HODLers” chart is currently distorted by Wall Street’s new spot ETF onramps into Bitcoin, Ethereum’s is not, reflecting the refusal of Ether HODLers to budge. Based on prior bull cycles, this is either highly bullish, or at least not bearish, depending on your perspective. Bitcoin continues to base. The balance of ETH HODLers continues to climb. While every trader must recognize the eternal truth that markets can do anything at any time, the simple fact right now is that there’s too much fret about normal market behavior.
So we HODL on.
Until next time…
peace_love_crypto-DB
IMPORTANT DISCLAIMER
The information presented and made available in this newsletter is intended for educational purposes only. THE INFORMATION IS NOT AND SHOULD NOT BE CONFUSED WITH INVESTMENT ADVICE AND DOES NOT ATTEMPT OR CLAIM TO BE A COMPLETE DESCRIPTION OF ANY SPECIFIC COINS, TOKENS OR MARKETS OF ANY KIND, BUT RATHER EDUCATIONAL EXAMPLES OF THE APPLICATION OF TECHNICAL ANALYSIS AND QUANTITATIVE ANALYSIS TO THE MARKET. This information has been presented and prepared without regard to any particular person's investment objectives, financial situation and particular needs because as individuals come from diverse backgrounds, with diverse objectives and financial situations. This information is of a general nature only so you should seek advice from your investment advisor or other financial professional as appropriate before taking any action. The opinions and analyses included herein are based on sources and data believed to be reliable and are presented in good faith, however no representation or warranty, expressed or implied is made as to their completeness or accuracy. It is imperative to understand your investment risks since all stock investments involve significant risk. The user of REKTelligence’s newsletters, podcasts, courses, coaching and other educational services agrees to indemnify and hold harmless REKTelligence LLC from and against any and all liabilities, expenses (including attorney's fees), and damages arising out of claims resulting from the use of this educational content. REKTelligence LLC is not a licensed investment advisor.
© 2024 REKTelligence LLC


