Risk On Looks In Jeopardy Amid Falling Liquidity Measures
IN TODAY’S REPORT
What we cover: Expanded Technical View edition. QQQ/SPY Ratio. Bitcoin with M2 in the denominator. The hard asset life raft.
THE (EXPANDED) TECHNICAL VIEW
With Bitcoin and Ether continuing to consolidate their June gains, little has changed since our last stats-driven report. In short, Bitcoin remains sandwiched between 30,000 support and 31,000 resistance. As we reported last week:
Once again Bitcoin pounds its fists on the 31,000 ceiling. But for all of its intraday effort, the king crypto has only managed a single successful end-of-day close above the key resistance level in 2023 so far. The psychologically important 30,000 level may have been vanquished, but it’s 31,000 that rules the day. [REKTelligence Report, 7/6/23]
For this reason, we’ll focus today’s research on the technical side by looking at two key charts reflecting important dynamics on different timeframes.
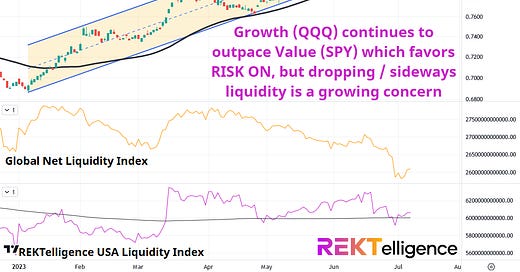
As we issue today’s report, growth stocks continue to outperform value stocks, illustrated best by looking at the QQQ/SPY ratio in which we put the SPY in the denominator instead of the US Dollar. This QQQ/SPY uptrend - a daily uptrend in innovation - remains firmly in place above its rising 50ma (black moving average in chart).
That said, Global Net Liquidity and the REKTelligence USA Liquidity Index no longer confirm new highs in the tech advance as global liquidity falls and domestic liquidity crabs sideways.
From a short to intermediate-term perspective, this divergence should concern all traders, as rising liquidity typically fuels rising asset prices and vice versa. While the possibility of the QQQ/SPY ratio breaking below its 50ma would almost assuredly see the stock market decline - potentially sharply - it’s our view that crypto would most likely also come under pressure though not to the same extent.
Simply put, crypto traders take note, but HODLers fear not.
NASDAQ 100 ETF / S&P 500 ETF (QQQ/SPY). Daily Chart with Global Net Liquidity Index and REKTelligence USA Liquidity Index.
Moving beyond the short and intermediate-term concerns, arguably the most important long-term financial trend is the modern growth in both M2 Money Supply and the Fed’s balance sheet. In a global system in which continued monetary debasement of fiat currencies remains the only way to maintain economic growth over time barring a productivity miracle, investors should seek the hardest assets possible.
If we replace the U.S. Dollar denominator with M2 Money Supply, we can see that with each successive bull cycle, Bitcoin continues to make new highs despite the massive M2 Money Supply growth. We firmly believe that a new Bitcoin high will eventually arrive, in both USD and M2 terms.
The S&P 500 Index, however, failed to outpace M2 Money Supply growth in the last bull cycle and remains in a wide trading range in M2 terms since pre-pandemic 2020. Amazingly, stocks are no higher in M2 terms than roughly 3.5 years ago.
BITCOIN/M2 vs SPX/M2. Weekly Chart, 2017 - Present.
No modern, debt-laden society will stand for a sustained government austerity program, and will proceed to remove any and all politicians who try to implement one. Why deliver hard truth and rations when bread and circuses will suffice? Politicians will always choose the latter. With occasional hiatuses, the money printing must continue. Most citizens will grudgingly tolerate the ongoing theft of inflation without understanding the root cause or fully grasping the solution.
Hard assets are the life raft, and the immutably fixed supply of Bitcoin remains the most effective defense against the ravages of long-term inflation and currency debasement.
THE TLDR
A Few Key Takeaways
✔ This QQQ/SPY uptrend - a daily uptrend in innovation - remains firmly in place above its rising 50ma
✔ Global Net Liquidity and the REKTelligence USA Liquidity Index no longer confirm new high
✔ Hard assets are the life raft
peace_love_crypto-DB
IMPORTANT DISCLAIMER
The information presented and made available in this newsletter is intended for educational purposes only. THE INFORMATION IS NOT AND SHOULD NOT BE CONFUSED WITH INVESTMENT ADVICE AND DOES NOT ATTEMPT OR CLAIM TO BE A COMPLETE DESCRIPTION OF ANY SPECIFIC COINS, TOKENS OR MARKETS OF ANY KIND, BUT RATHER EDUCATIONAL EXAMPLES OF THE APPLICATION OF TECHNICAL ANALYSIS AND QUANTITATIVE ANALYSIS TO THE MARKET. This information has been presented and prepared without regard to any particular person's investment objectives, financial situation and particular needs because as individuals come from diverse backgrounds, with diverse objectives and financial situations. This information is of a general nature only so you should seek advice from your investment advisor or other financial professional as appropriate before taking any action. The opinions and analyses included herein are based on sources and data believed to be reliable and are presented in good faith, however no representation or warranty, expressed or implied is made as to their completeness or accuracy. It is imperative to understand your investment risks since all stock investments involve significant risk. The user of REKTelligence’s newsletters, podcasts, courses, coaching and other educational services agrees to indemnify and hold harmless REKTelligence LLC from and against any and all liabilities, expenses (including attorney's fees), and damages arising out of claims resulting from the use of this educational content. REKTelligence LLC is not a licensed investment advisor.
© 2023 REKTelligence LLC


