


Recent Bitcoin Gains Suggest Further Upside

IN TODAY’S REPORT
What we cover: Bitcoin gains >= 9% in last seven days while above its rising 200ma. 2011 - now results vs. last 5 years.
TODAY’S STATS
Bitcoin Vaults Over 9% in Just Seven Days
On Monday - just two days back - we examined the ever-tightening range between the highest close and lowest close over the past 90 days as Bitcoin HODLers refused to part with their coin despite the government’s attempt to choke off further access to crypto in the United States.
It’s our view that the inside forces behind the government’s immense power of fiat profligacy (shared by all recent administrations of both major political parties) must attempt to limit the growth of outside money like Bitcoin. Unlike a typical boat with a leaky hull, the more people who exit the leaking fiat ocean liner, the faster the massive ship sinks. While the attack vector may aim squarely at the crypto onramps, price continues to hold within an increasingly bullish daily bull flag pattern, and with Bitcoin’s 90-day Rangeometer also now falling to the extreme low level… [6/19/23]
The stats for Monday’s narrow 90-day Rangometer reading were exceptionally bullish, and here we are now just two days later with Bitcoin breaking out of its daily bull flag pattern and poised to once again challenge the whole round number of $30,000. With Bitcoin now up over 9% in just seven days (excluding today’s intraday gains which are not yet official so far ahead of the candle’s completion), let’s examine whether to expect more upside or a downward retracement in price going forward.
BITCOIN (BTC/USD). Daily Chart with Today’s Conditions.

OUR BITCOIN QUERY'S SETUP CONDITIONS:

CONDITION 1: Bitcoin gains >= 9% in last 7 days
CONDITION 2: Bitcoin closes above its 200ma
CONDITION 3: Bitcoin's 200ma is rising


ENTRY AND EXIT CONDITIONS:

1. ENTRY CONDITION: Enter long ("buy") at the open of the next candle
2. EXIT CONDITION: Exit ("sell") 90-days later
Here are the results using a 90-day hold:
BITCOIN (BTC/USD). Query Results for BTC with a 90-day Hold. Last 5 Years.
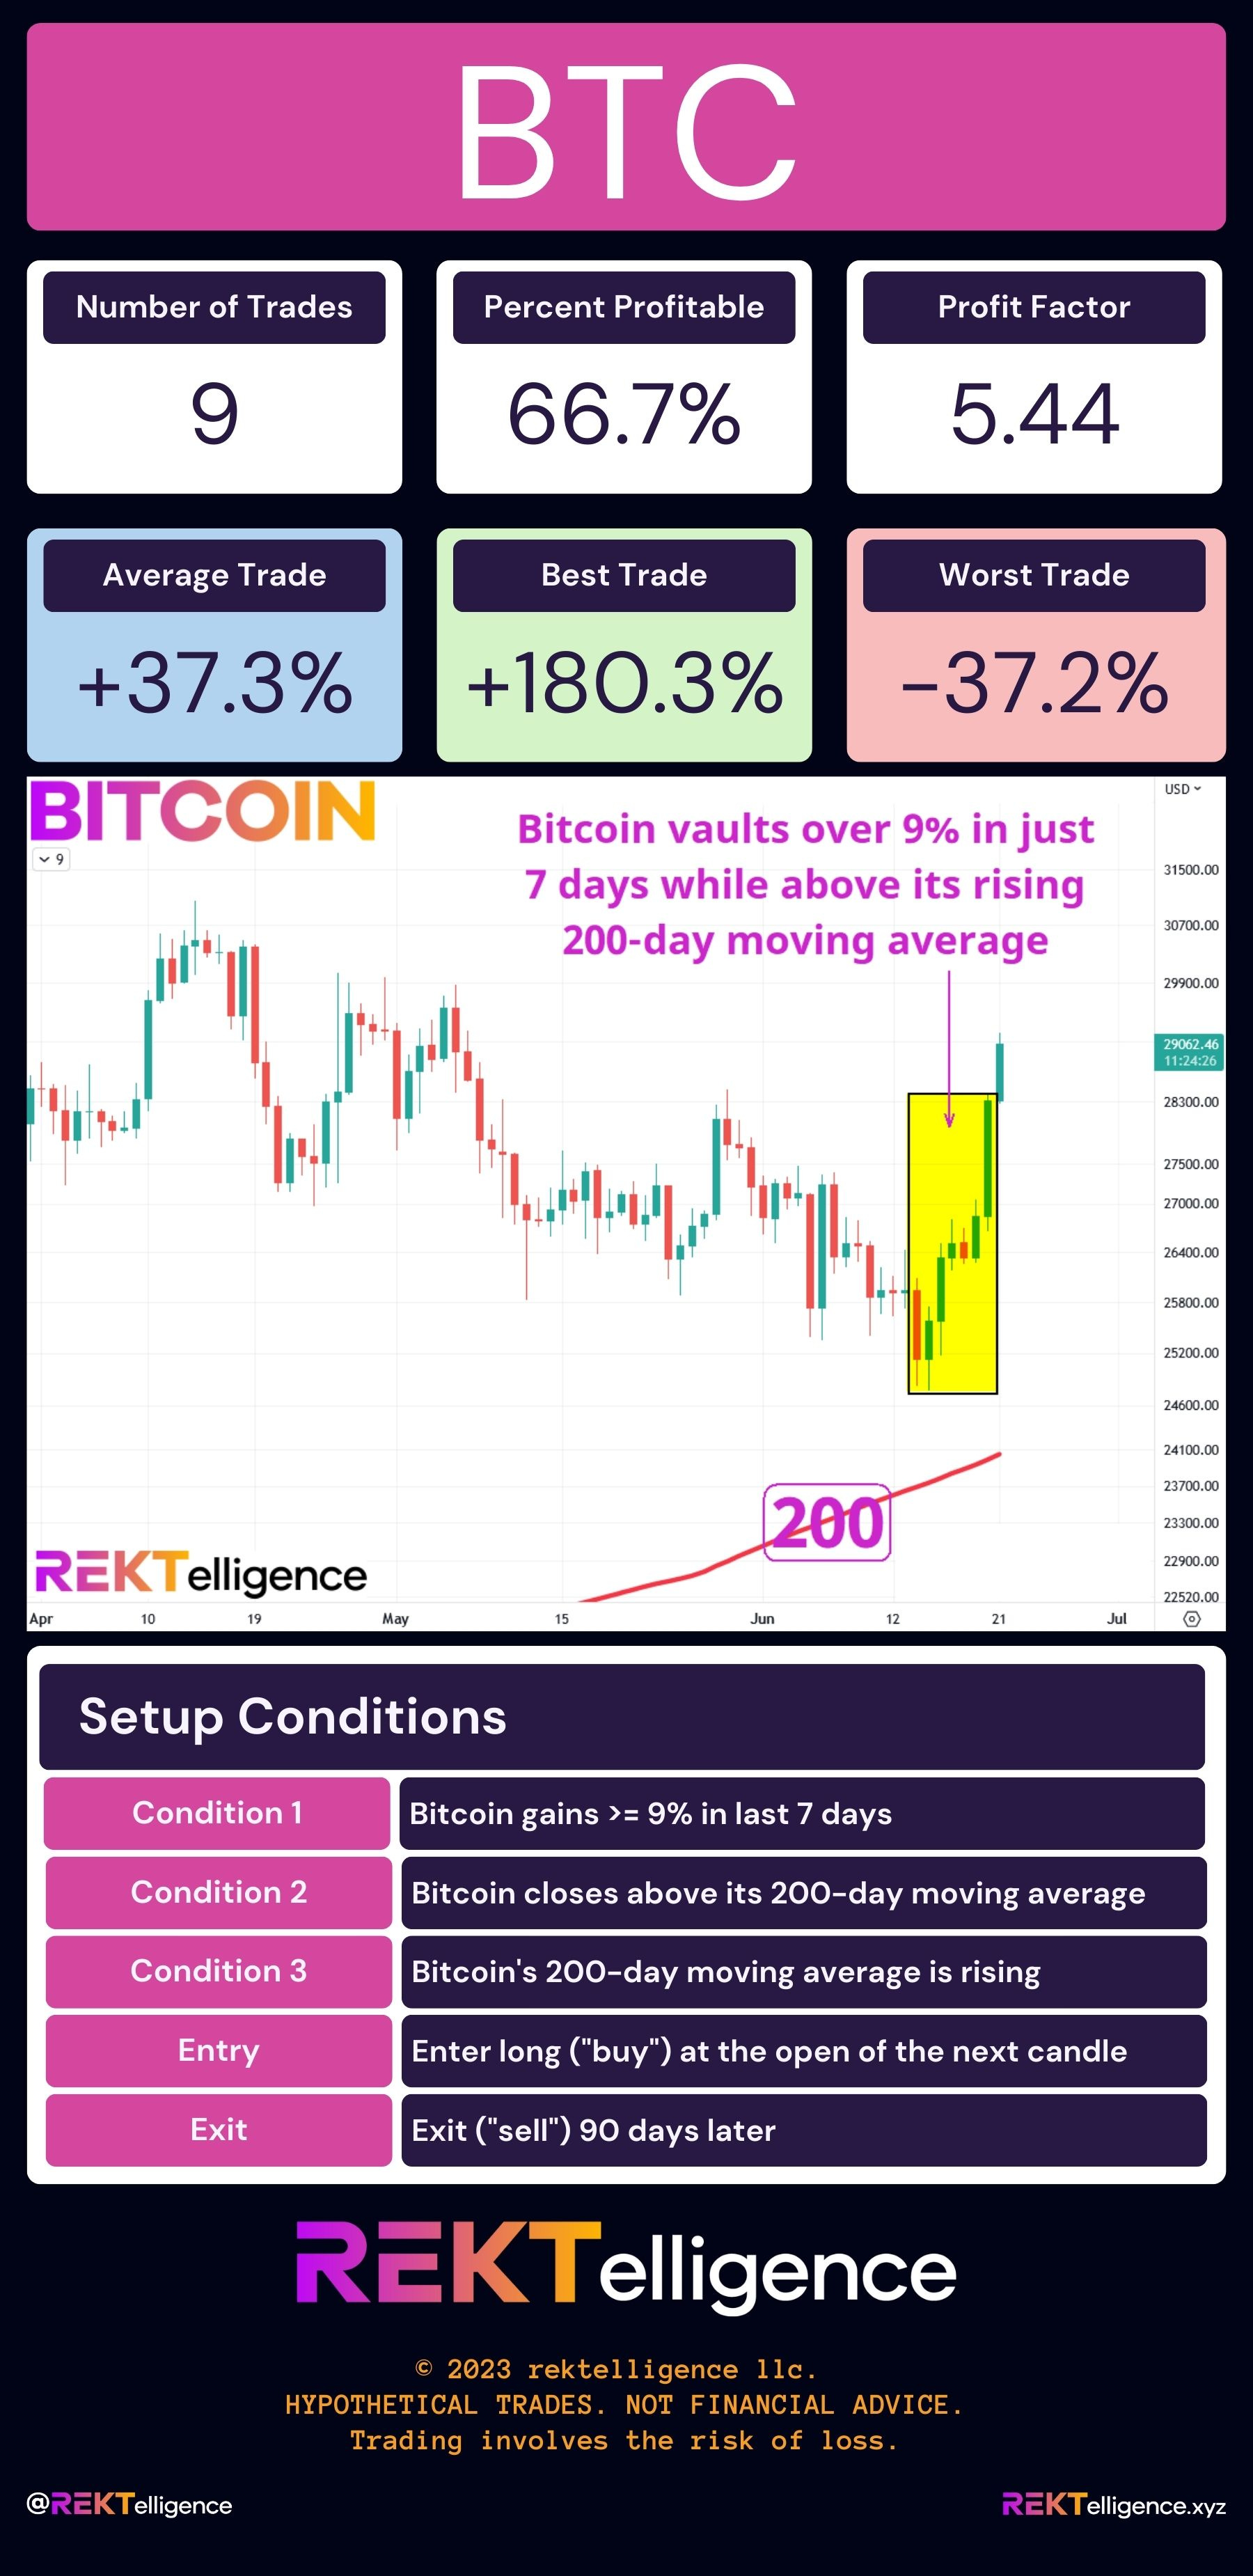
Using a 90-day hold and only more recent data (i.e., last five years from 6/21/18 through end of day 6/20/23), the average trade of +37.3% strongly suggests further upside and the same result from current levels would put Bitcoin at $38,880 by later September 2023, hypothetically speaking. While the best result of the last five years under these conditions was a massive +180.3% gain, the worst trade of -37.2% occurred during November 2021, just before Bitcoin’s all time high, closing out for a loss in February 2022 as the market went into its brutal hibernation.
Now let’s look at Bitcoin’s results for Average Trade across various holding times ranging from 7 days to one year using data from 2011- Now. Note that the Win % shows how many trades were profitable, hypothetically speaking.
BITCOIN (BTC/USD). Hold Time Results for Today’s Conditions. 2011-Now.

From 2011 to the present, results for average trade are strong across the board, jumping dramatically using a 6-month hold time, with the win rate generally increasing in line with hold time. As we’ll see, if we limit data to just the last five years, average trade results paint a slightly less bullish picture.
BITCOIN (BTC/USD). Hold Time Results for Today’s Conditions. Last 5 Years.

Average trade results remain positive across the board, though show less robust gains relative to the 2011 to present data. That said, beyond the short to intermediate-term window, a hold time of 90 days or more over the past five years shows powerful gain potential for Bitcoin following this week’s price advance. Combined with our quantification of Monday’s range restriction conditions, the Bulls solidly appear to have the upper hand as summer begins.
THE TLDR
A Few Key Takeaways
✔ Bitcoin is breaking out of its daily bull pattern and looks poised to once again challenge the whole round number of $30,000
✔ The average trade of +37.3% strongly suggests further upside and the same result from current levels would put Bitcoin at $38,880 by later September 2023, hypothetically speaking
✔ If we limit data to just the last five years, average trade results paint a slightly less bullish picture
✔ The Bulls solidly appear to have the upper hand as summer begins
peace_love_crypto-DB
IMPORTANT DISCLAIMER
The information presented and made available in this newsletter is intended for educational purposes only. THE INFORMATION IS NOT AND SHOULD NOT BE CONFUSED WITH INVESTMENT ADVICE AND DOES NOT ATTEMPT OR CLAIM TO BE A COMPLETE DESCRIPTION OF ANY SPECIFIC COINS, TOKENS OR MARKETS OF ANY KIND, BUT RATHER EDUCATIONAL EXAMPLES OF THE APPLICATION OF TECHNICAL ANALYSIS AND QUANTITATIVE ANALYSIS TO THE MARKET. This information has been presented and prepared without regard to any particular person's investment objectives, financial situation and particular needs because as individuals come from diverse backgrounds, with diverse objectives and financial situations. This information is of a general nature only so you should seek advice from your investment advisor or other financial professional as appropriate before taking any action. The opinions and analyses included herein are based on sources and data believed to be reliable and are presented in good faith, however no representation or warranty, expressed or implied is made as to their completeness or accuracy. It is imperative to understand your investment risks since all stock investments involve significant risk. The user of REKTelligence’s newsletters, podcasts, courses, coaching and other educational services agrees to indemnify and hold harmless REKTelligence LLC from and against any and all liabilities, expenses (including attorney's fees), and damages arising out of claims resulting from the use of this educational content. REKTelligence LLC is not a licensed investment advisor.
© 2023 REKTelligence LLC