


Raoul Pal's Right. #DFTU
Bitcoin's Technical State Confirms Bullish Expectations

IN TODAY’S REPORT
What we cover: STATS EDITION. Bitcoin’s current technical state and future implications. Tossing the outlier. Raoul Pal and #DFTU.
TODAY’S STATS
Defining Bitcoin’s Technical State
As the consolidation continues, Bitcoin’s technical position can be defined in a number of ways. Today we’ll look at a couple relevant moving averages together with the classic Relative Strength Index indicator to assess what might be next for the king crypto.
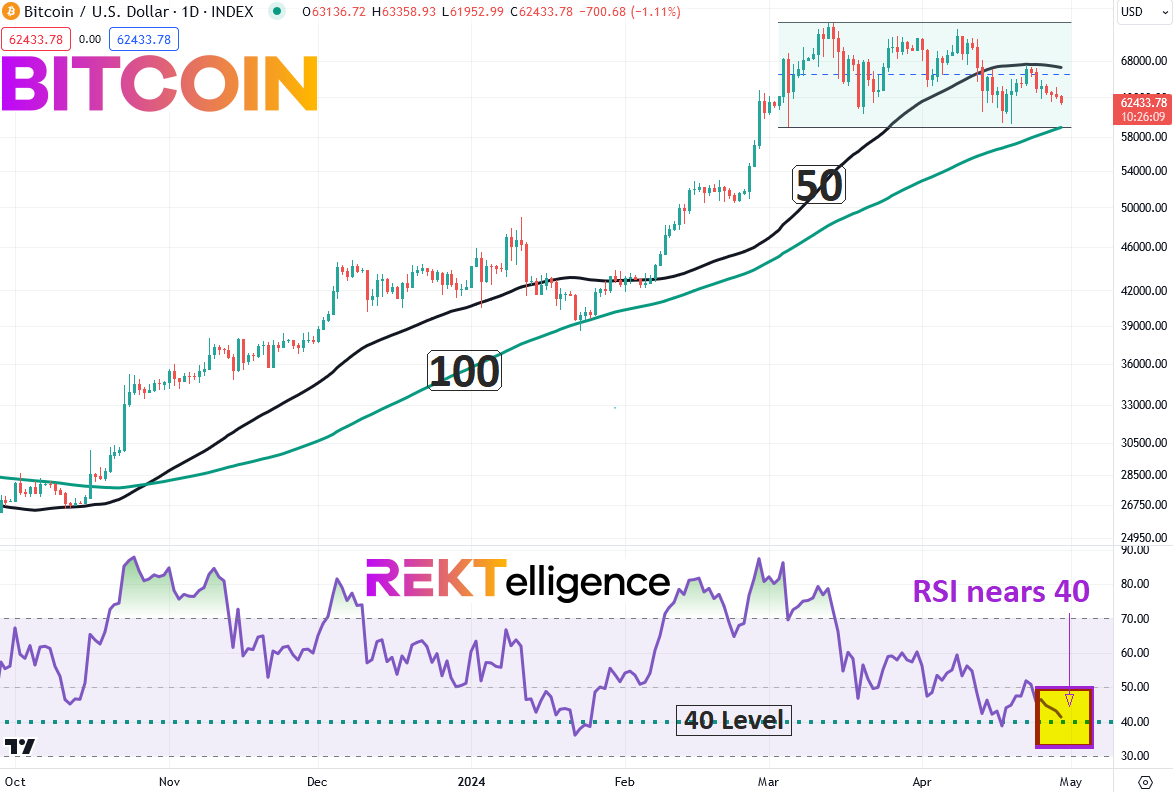
Before we look at the stats, here’s the rationale for the conditions used in today’s analysis. The widely watched 50-day moving average (50ma) is often a good representation of intermediate-term momentum while the 100-day moving average (100ma) has so far acted as support for Bitcoin since its current upswing began in late October 2023.
Bitcoin now sits in between a rising 100ma and a gently falling 50ma, signifying slowing momentum within an established uptrend. Described this way, no moving averages are necessary to arrive at the simple conclusion that Bitcoin’s uptrend has slowed of late. It’s patently obvious.
But how often has this technical state occurred in its history? What’s happened next? The moving averages help answer those important questions by precisely defining the technical state we’re currently in. We’ll also use the RSI(14) to further define the length of consolidation as it typically falls as price enters a sideways time correction such as we’re now witnessing.
Now on to the analysis!
BITCOIN (BTC/USD). Daily Chart with 50ma, 100ma, and RSI(14).
To take a closer look at the future implications of the current setup, we need to run a simple test over all of Bitcoin’s reliable history from 2011 to the present. Our “query conditions” represent a basic definition of the technical state of BTCUSD. The simpler the conditions the more data points we get to consider (three conditions is our typical max).
First, our simple query conditions with a 90-day hold:
BITCOIN SETUP CONDITIONS

CONDITION 1: Bitcoin closes below its falling 50ma
CONDITION 2: Bitcoin closes above its rising 100ma
CONDITION 3: Bitcoin's RSI(14) is =< 40

Note: Bitcoin's RSI(14) is not yet at 40 or lower, but could potentially meet this condition within a few days.


ENTRY AND EXIT CONDITIONS:

1. ENTRY CONDITION: Enter long ("buy") at the open of the next candle
2. EXIT CONDITION: Exit ("sell") 90-days laterSince 2011, Bitcoin has experienced these conditions just 9 times — a fairly uncommon event. On the chart below, we display all hypothetical trades since 2011, shown with a 90-day hold time. The dates below correspond to the hypothetical EXIT DATE of the setup (i.e., 90 days after the setup conditions have been met).
BITCOIN (BTC/USD). Today’s Conditions: All Trades w/ 90-day Hold. 2011-Now.

As we typically see in these queries, the largest gain occurred in 2011 — the huge outlier of +1794.67% — while the largest loss of -72.95% also occurred in 2011. Since 2018, the magnitude of gains has been more muted but with no losses since 2014.
With only 2 closed losses to date using our conditions, Bitcoin has gained following this setup precisely 77.7% of the time.
Now let’s throw out the 2011 outlier from Bitcoin’s early history and get an arguably more realistic look at what we might expect going forward.
BITCOIN (BTC/USD). All Trades w/ 90-day Hold, EXCLUDING OUTLIER. 2011-Now.

Tossing out 2011’s exceptional trade of +1794.67%, the average trade drops precipitously from +220% to a “mere” +23%. This is not to say that we couldn’t see another massive trade in the future, but losing the outlier provides a more conservative expectation better in line with today’s crypto market dynamics.
A conservative 23% gain from Bitcoin’s current level of $62,975 (intraday April 29th, 2024) would put Bitcoin at $77,459 by late July. Another recent statistical analysis we performed earlier this month put Bitcoin at 133,000 by early July. Taking the average, we’d potentially see Bitcoin at $105,229 this summer. LFG.
Beyond these stats, there are many important tailwinds at crypto’s back, from improving liquidity to spot Bitcoin ETF adoption to election year market dynamics to the recent Halving. And this is only a partial list of probabilistically positive factors. This Bull remains firmly in tact without any (major) topping signals.
To quote the macro-crypto maverick Raoul Pal — and we couldn’t agree more — DON’T FUCK THIS UP.
#DFTU
#HODL
Until next time…
peace_love_crypto-DB

IMPORTANT DISCLAIMER
The information presented and made available in this newsletter is intended for educational purposes only. THE INFORMATION IS NOT AND SHOULD NOT BE CONFUSED WITH INVESTMENT ADVICE AND DOES NOT ATTEMPT OR CLAIM TO BE A COMPLETE DESCRIPTION OF ANY SPECIFIC COINS, TOKENS OR MARKETS OF ANY KIND, BUT RATHER EDUCATIONAL EXAMPLES OF THE APPLICATION OF TECHNICAL ANALYSIS AND QUANTITATIVE ANALYSIS TO THE MARKET. This information has been presented and prepared without regard to any particular person's investment objectives, financial situation and particular needs because as individuals come from diverse backgrounds, with diverse objectives and financial situations. This information is of a general nature only so you should seek advice from your investment advisor or other financial professional as appropriate before taking any action. The opinions and analyses included herein are based on sources and data believed to be reliable and are presented in good faith, however no representation or warranty, expressed or implied is made as to their completeness or accuracy. It is imperative to understand your investment risks since all stock investments involve significant risk. The user of REKTelligence’s newsletters, podcasts, courses, coaching and other educational services agrees to indemnify and hold harmless REKTelligence LLC from and against any and all liabilities, expenses (including attorney's fees), and damages arising out of claims resulting from the use of this educational content. REKTelligence LLC is not a licensed investment advisor.
© 2024 REKTelligence LLC