


Latest SEC Salvo Pushes Ethereum to a Bullish Technical Position

IN TODAY’S LETTER
What we cover: The SEC’s latest enforcement actions push Ether to a 10-day low. Hold time stats for Ether’s technical setup. Intermediate-term questions. New HODLer balance highs suggest new BTC highs will eventually follow.
TODAY’S STATS
Ether’s Close at a 10-day Low Appears Bullish
The latest salvo in the SEC’s ongoing regulation by enforcement campaign came midday Monday with its lawsuit of the world’s largest exchange Binance. Tuesday brought a similar suit against leading U.S.-based crypto exchange Coinbase, a publicly-traded company listed on the NASDAQ accused of being an “unregistered crypto broker.” The rapid fire one-two punch against these major exchanges immediately weighed on crypto assets nearly across the board Monday, pushing Ethereum to close at a 10-day low, but still above its rising 100-day moving average (100ma). Today we’ll examine how Ether has fared in the past when it’s closed in this technical position. Let’s run the stats!
ETHER (ETH/USD). Daily Chart with rising 100ma.

Our first query is simple: how has Ether (ETHUSD) performed historically when it closes at a 10-day low while above its rising 100ma? We’ll first look at a simple “sell 90 days later” scenario before looking at various holding times.
OUR ETHER QUERY'S SETUP CONDITIONS:

CONDITION 1: Ether closes at a 10-day low
CONDITION 2: Ether closes above its 100ma
CONDITION 3: Ether's 100ma is rising


ENTRY AND EXIT CONDITIONS:

1. ENTRY CONDITION: Enter long ("buy") at the open of the next daily candle
2. EXIT CONDITION: Exit ("sell") 90 days later
Here are the results using a 90-day hold:
ETHER (ETH/USD). Query Results for ETH with a 90-day Hold. 2016-Now.

Since 2016 - the start of reliable data for Ethereum - there have been 16 instances of this setup, with the pattern occurring in every year of Ether’s existence with the exception of 2022’s relentless bear market in which ETH’s 100ma rarely rose. Profitable 75% of the time with a 90-day hold, the average trade has historically delivered an impressive +71.9% gain with its best trade of over +433% occurring in the bull run of 2017 and its worst trade of -37.9% occurring during the start of the 2018 Crypto Winter. Ether’s second worst trade of -31.28% happened in a time arguably similar to today’s conditions: 2019’s transitional year between 2018’s bear market and 2020’s Bitcoin halving event in which Bitcoin’s block reward was cut in half, reducing its supply on the cryptographically-enforced schedule set in motion on January 3, 2009. Perhaps most impressive is the Profit Factor of 12.44, indicating that the sum of hypothetical gross gains is over 12 times the sum of gross losses.
Now let’s look at Ether’s results for Average Gain and Average Loss across various holding times ranging from 7 days to a 365 days using data from 2016-now. Note that the Win % shows how many trades were profitable, hypothetically speaking.
ETHER (ETH/USD). Hold Time Results for Today’s Conditions. 2016-Now.

While the short-term 7-day and 15-day results appear only mildly bullish with a slight edge in profitability (i.e., Win % only slightly better than a coin flip), hold times of 60-days and beyond show a strongly bullish propensity with the average loss only breaking below -25% once.
In recent letters - between all of the Bitcoin and Ether studies - we’ve seen a mixed bag of short and intermediate-term results, with today’s results clearly landing on the bullish side of the ledger. While the long-term prospects for both Bitcoin and Ether remain overwhelmingly bullish in study after study, the intermediate-term prospects remain the most challenging to assess with months to go before the 2024 Bitcoin halving event, an uncertain regulatory environment in the USA, a pivotal national election ahead, and a looming potential recession on the horizon. For this reason, the worst trade and average loss stats should be seriously considered and factored into every trader and investor’s risk management approach. Ultimately however, with Ethereum now a deflationary asset with a steadily diminishing supply following last year’s Merge to its new consensus mechanism, its future appears especially bright in our view, even with storm clouds on the North American horizon.
THE TECHNICAL VIEW
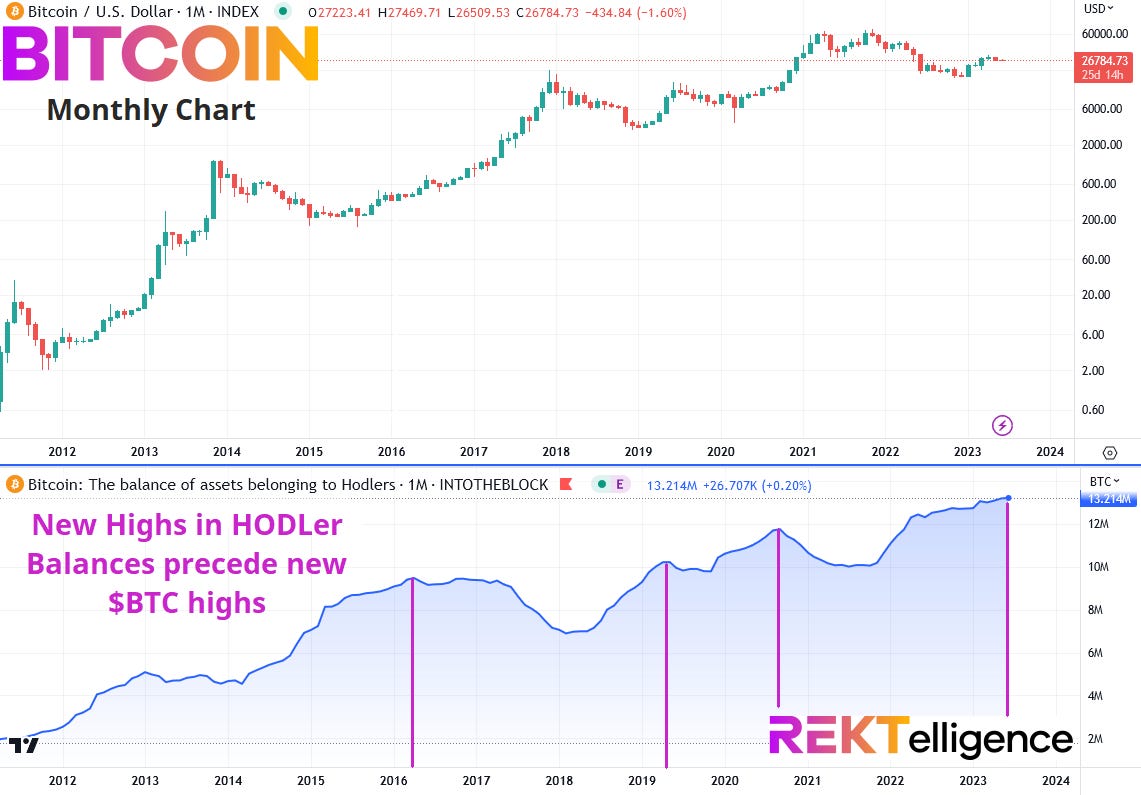
New HODLer Balance Highs Suggest New Bitcoin Highs Will Follow
Beyond the short-term and intermediate-term horizons, Bitcoin continues to see the Balance of Assets belonging to HODLers (one-year holders and beyond) climb to new highs. New highs in HODLer balances have historically preceded new highs in price (see vertical lines on chart below), suggesting that Bitcoin is currently on track to move beyond the 70,000 mark in the next bull run. For those thinking ahead, note the bearish divergences which have occurred ahead of Bitcoin tops, in which the HODLer balances have fallen before Bitcoin tops out, indicating that long-term holders are finally willing to part with their coins while the bulls are still running. If historical trends continue to hold up, we will be revisiting this chart in the coming months, looking for any meaningful negative divergence suggesting it may be time to de-HODL and lock in gains.
BITCOIN (BTC/USD). Monthly Chart with Balance of Assets belonging to HODLers.
THE TLDR
A Few Key Takeaways
✔ Since 2016, there have been 16 instances occurring in every year of Ether’s existence with the exception of 2022’s relentless bear market
✔  Ether’s second worst trade of -31.28% happened in a time arguably similar to today’s conditions: 2019’s transitional year
✔ New highs in Bitcoin HODLer balances have historically preceded new highs
peace_love_crypto-DB
IMPORTANT DISCLAIMER
The information presented and made available in this newsletter is intended for educational purposes only. THE INFORMATION IS NOT AND SHOULD NOT BE CONFUSED WITH INVESTMENT ADVICE AND DOES NOT ATTEMPT OR CLAIM TO BE A COMPLETE DESCRIPTION OF ANY SPECIFIC COINS, TOKENS OR MARKETS OF ANY KIND, BUT RATHER EDUCATIONAL EXAMPLES OF THE APPLICATION OF TECHNICAL ANALYSIS AND QUANTITATIVE ANALYSIS TO THE MARKET. This information has been presented and prepared without regard to any particular person's investment objectives, financial situation and particular needs because as individuals come from diverse backgrounds, with diverse objectives and financial situations. This information is of a general nature only so you should seek advice from your investment advisor or other financial professional as appropriate before taking any action. The opinions and analyses included herein are based on sources and data believed to be reliable and are presented in good faith, however no representation or warranty, expressed or implied is made as to their completeness or accuracy. It is imperative to understand your investment risks since all stock investments involve significant risk. The user of REKTelligence’s newsletters, podcasts, courses, coaching and other educational services agrees to indemnify and hold harmless REKTelligence LLC from and against any and all liabilities, expenses (including attorney's fees), and damages arising out of claims resulting from the use of this educational content. REKTelligence LLC is not a licensed investment advisor.
© 2023 REKTelligence LLC