


Large Bitcoin Advance Points to More Gains Ahead

IN TODAY’S REPORT
What we cover: Bitcoin just gained over 21% within 10 days while above its rising 200-day moving average (200ma). 2011 - now results vs. last 5 years. Baseline Buy and Hold vs the current technical setup for a 60-day hold.
TODAY’S STATS
Bitcoin Gains +21% in Just Ten Days and the Stats Look Compelling
With our REKTelligence Rangeometer reading flashing a bullish signal just two days before the breakout, Bitcoin continued the hugely impressive run we anticipated earlier this month, gaining over +21% in just ten sessions before pausing over the weekend.
While past never predicts future, probability suggests that Bitcoin appears poised for a robust rally from this extremely low range bull flag pattern. With many of the current administration’s forces obscuring any light at the end of tunnel, it may just be darkest right before the stampede.
[Excerpt from “Our Bitcoin Rangeometer Says Get Ready for Likely Stampede” - 6/19/23]
With these gains now in the rearview mirror, Let’s take a look at what to expect next after a rally of this magnitude in such a short window of time.
BITCOIN (BTC/USD). Daily Chart with Today’s Conditions.

OUR BITCOIN QUERY'S SETUP CONDITIONS:

CONDITION 1: Bitcoin gains >= 21% within 10 days
CONDITION 2: Bitcoin closes above its 200ma
CONDITION 3: Bitcoin's 200ma is rising


ENTRY AND EXIT CONDITIONS:

1. ENTRY CONDITION: Enter long ("buy") at the open of the next candle
2. EXIT CONDITION: Exit ("sell") N-days later
Our test conditions use the 200-day moving average and its rising slope as filters to better match Bitcoin’s current conditions to similar past conditions while not filtering out too many data points, keeping our query specific enough while avoiding too narrow of a sample. Let’s take a look at results for Average Trade across various holding times ranging from 7 days to one year using data from 2011- now. Note that the Win % shows how many trades were profitable, hypothetically speaking.
BITCOIN (BTC/USD). Hold Time Results for Today’s Conditions. 2011-Now.

From 2011 to the present, results for average trade are incredibly strong across the board, jumping dramatically using a 60-day hold time and beyond, with the win rate (percent profitable) well above the 50% mark, ranging between 65% and 78%. Taking a look solely at the 60-day hold time, the above +101.8% result with a 65% win rate easily beats Bitcoin’s baseline average 60-day gain of +34.6% with a 57.3% win rate. In other words, the current technical setup (i.e., today’s three query conditions listed earlier) shows a higher probability of profit historically, with a much larger average trade.
If we limit ourselves to only the last five years, we see a more measured picture, below.
BITCOIN (BTC/USD). Hold Time Results for Today’s Conditions. Last 5 Years.
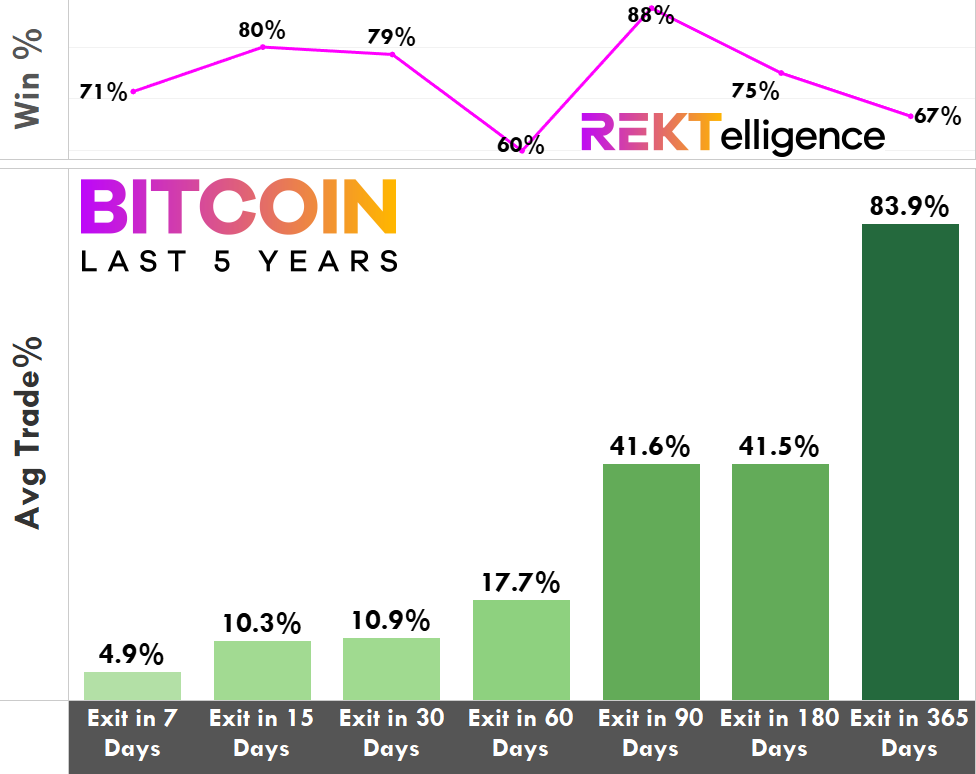
While clearly more muted, the same conditions show impressive results despite the occurrence of two bear markets (2018 and 2022) within the test period (6/26/2018 to present). If we once again compare a simple “buy BTCUSD and hold for 60 days” against our three conditions, the current technical setup once again delivers superior results. Today’s conditions show a +17.7% average trade in 60 days with a 60% win rate as opposed to a buy-and-hold result of just +10.9% with a 53.3% win rate over the same 60-day period. The Bulls have clearly been emboldened on Crypto Twitter after Bitcoin’s latest advance, and the data shows that it’s for good reason. The stampede arrived, and the bears should get out of the way. For the moment, the odds favor the Bulls.
THE TLDR
A Few Key Takeaways
✔ Taking a look solely at the 60-day hold time, the above +101.8% result with a 65% win rate easily beats Bitcoin’s baseline average 60-day gain
✔ Even over just the last 5 years, Bitcoin's current technical setup delivers superior results to a baseline buy and hold result
✔ For the moment, the odds favor the Bulls
peace_love_crypto-DB
IMPORTANT DISCLAIMER
The information presented and made available in this newsletter is intended for educational purposes only. THE INFORMATION IS NOT AND SHOULD NOT BE CONFUSED WITH INVESTMENT ADVICE AND DOES NOT ATTEMPT OR CLAIM TO BE A COMPLETE DESCRIPTION OF ANY SPECIFIC COINS, TOKENS OR MARKETS OF ANY KIND, BUT RATHER EDUCATIONAL EXAMPLES OF THE APPLICATION OF TECHNICAL ANALYSIS AND QUANTITATIVE ANALYSIS TO THE MARKET. This information has been presented and prepared without regard to any particular person's investment objectives, financial situation and particular needs because as individuals come from diverse backgrounds, with diverse objectives and financial situations. This information is of a general nature only so you should seek advice from your investment advisor or other financial professional as appropriate before taking any action. The opinions and analyses included herein are based on sources and data believed to be reliable and are presented in good faith, however no representation or warranty, expressed or implied is made as to their completeness or accuracy. It is imperative to understand your investment risks since all stock investments involve significant risk. The user of REKTelligence’s newsletters, podcasts, courses, coaching and other educational services agrees to indemnify and hold harmless REKTelligence LLC from and against any and all liabilities, expenses (including attorney's fees), and damages arising out of claims resulting from the use of this educational content. REKTelligence LLC is not a licensed investment advisor.
© 2023 REKTelligence LLC