


It's Not The ALTpocalypse
Key Charts for Navigating Crypto's Wily Altcoin Universe

IN TODAY’S REPORT
What we cover: TECHNICAL ANALYSIS Edition. TOTAL3 testing potential support. REKTelligence Stretch %. The AltCap Index. Bottom 90% Dominance below 10%.
Medieval Times Are Back
The present state of the crypto market brings to mind the long and grinding centuries of medieval existence. Lords Bitcoin and Ether remain warm, fed and holed up in their lofty castle keeps while the rest of the kingdom — the altcoin vassals and plebes — suffer amid the mud and muck of abject poverty.
Such is the current technical action of the broader crypto market. While Bitcoin and Ether remain within reasonable reach of their March 2024 highs, altcoins steadily bleed value as their own March highs become a distant memory.
But all that said, it’s not the ALTpocalypse. Alts now appear closer to a short to intermediate-term low than to another meaningful leg down.
In this Technical Analysis Edition, we’ll look at four charts crucial for understanding when demand may be returning to the altcoin universe.
TOTAL CRYPTO MARKET CAP Excluding $BTC & $ETH (TOTAL3) with 200ma.
A simple daily chart of TOTAL3 — a decent proxy for an altcoin index — shows alts have now fallen to test the lower boundary of their symmetrical triangle and 200-day moving average as the current malaise continues. Note that while recent volume has been muted relative to March levels, today’s volume will likely end up being the highest in a month or more. All these factors suggest that alts are more likely closer to a swing low and potential bottom than to another meaningful leg down.
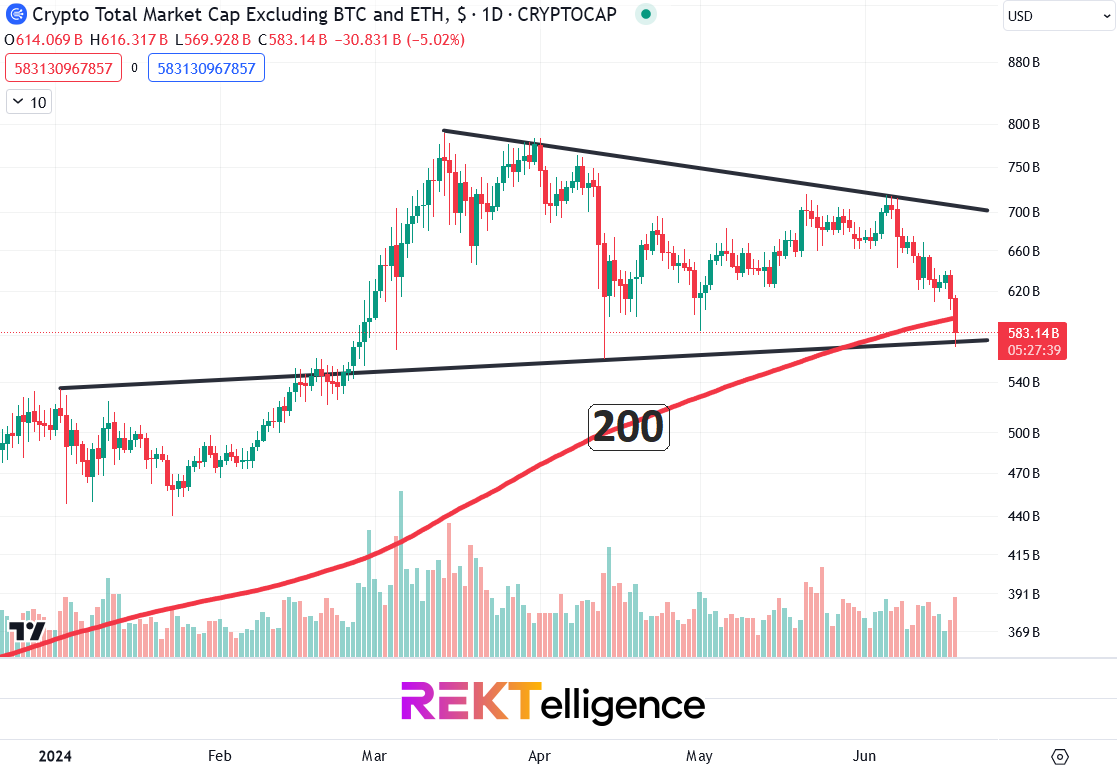
TAKEAWAY: Look for reversal candles in this area and ideally a hold of the triangle's lower boundary. That said, there's more to the story so read on. CRYPTO TOTAL MARKET CAP Excluding Top 10 Dominance (OTHERS.D) with REKTelligence Stretch % Indicator. Weekly Chart.
Showing the Total Market Cap excluding Top 10 Dominance, the scale on the right hand side shows “9.57%”, indicating that after you ditch the top ten cryptos and the market cap percentage they represent, all that's left is 9.57%. In other words, this chart essentially shows the Bottom 90% of the cryptoverse, in dominance terms.
If we apply our own Stretch % indicator to this chart, we see that OTHERS.D is currently stretched roughly -20% below its 20-week moving average. Over the past four years, the -20% level — highlighted in green below — has seen at the very least a tradable altcoin bounce if not a significant rally.

TAKEAWAY: According to the REKTelligence STRETCH % indicator, the Bottom 90% is now in washout territory and more likely to see demand than another major leg down.REKTelligence AltCap Index with 365ema.
Our AltCap Index takes TOTAL3 and removes all of the significant stablecoins, resulting in a truer altcoin index. The 365-day exponential moving average shown below has acted as a fairly reliable dividing line between favorable and unfavorable periods, with the 365ema acting as a support level during the last bull cycle in 2021.

TAKEAWAY: The AltCap Index may be headed to the 365ema again, where we’ll look for a stabilization and potential bounce.CRYPTO TOTAL MARKET CAP Excluding Top 10 Dominance (OTHERS.D) with Monthly Heikin Ashi Candles.
Potentially less helpful but still worth sharing, OTHERS.D displayed on a monthly Heikin Ashi chart does a great job visualizing Altcoin Risk On vs Altcoin Risk Off over the past several years. Risk On shown in yellow.

TAKEAWAY: If this bull cycle eventually delivers new highs as expected and alts see a torrent of renewed demand, we could see Bottom 90% Dominance reach 20% or higher. We’re currently below 10%. Take heart all ye lovers of alts. While we primarily stick to Bitcoin and Ethereum, your day will eventually come.
Until next time…
peace_love_crypto-DB
IMPORTANT DISCLAIMER
The information presented and made available in this newsletter is intended for educational purposes only. THE INFORMATION IS NOT AND SHOULD NOT BE CONFUSED WITH INVESTMENT ADVICE AND DOES NOT ATTEMPT OR CLAIM TO BE A COMPLETE DESCRIPTION OF ANY SPECIFIC COINS, TOKENS OR MARKETS OF ANY KIND, BUT RATHER EDUCATIONAL EXAMPLES OF THE APPLICATION OF TECHNICAL ANALYSIS AND QUANTITATIVE ANALYSIS TO THE MARKET. This information has been presented and prepared without regard to any particular person's investment objectives, financial situation and particular needs because as individuals come from diverse backgrounds, with diverse objectives and financial situations. This information is of a general nature only so you should seek advice from your investment advisor or other financial professional as appropriate before taking any action. The opinions and analyses included herein are based on sources and data believed to be reliable and are presented in good faith, however no representation or warranty, expressed or implied is made as to their completeness or accuracy. It is imperative to understand your investment risks since all stock investments involve significant risk. The user of REKTelligence’s newsletters, podcasts, courses, coaching and other educational services agrees to indemnify and hold harmless REKTelligence LLC from and against any and all liabilities, expenses (including attorney's fees), and damages arising out of claims resulting from the use of this educational content. REKTelligence LLC is not a licensed investment advisor.
© 2024 REKTelligence LLC