IN TODAY’S REPORT
What we cover: STATS EDITION. Bitcoin’s current technical setup. Diminishing losses under current conditions. Bitcoin $114,730?
TODAY’S STATS
Reset Accomplished
In our last report, Bitcoin's Approaching Reset, we stated that…
We could potentially be approaching another reset point for Bitcoin, and an opportunity for those seeking exposure to the king crypto to acquire it at a tactically advantageous moment (7/08/24, BTC $56,745)
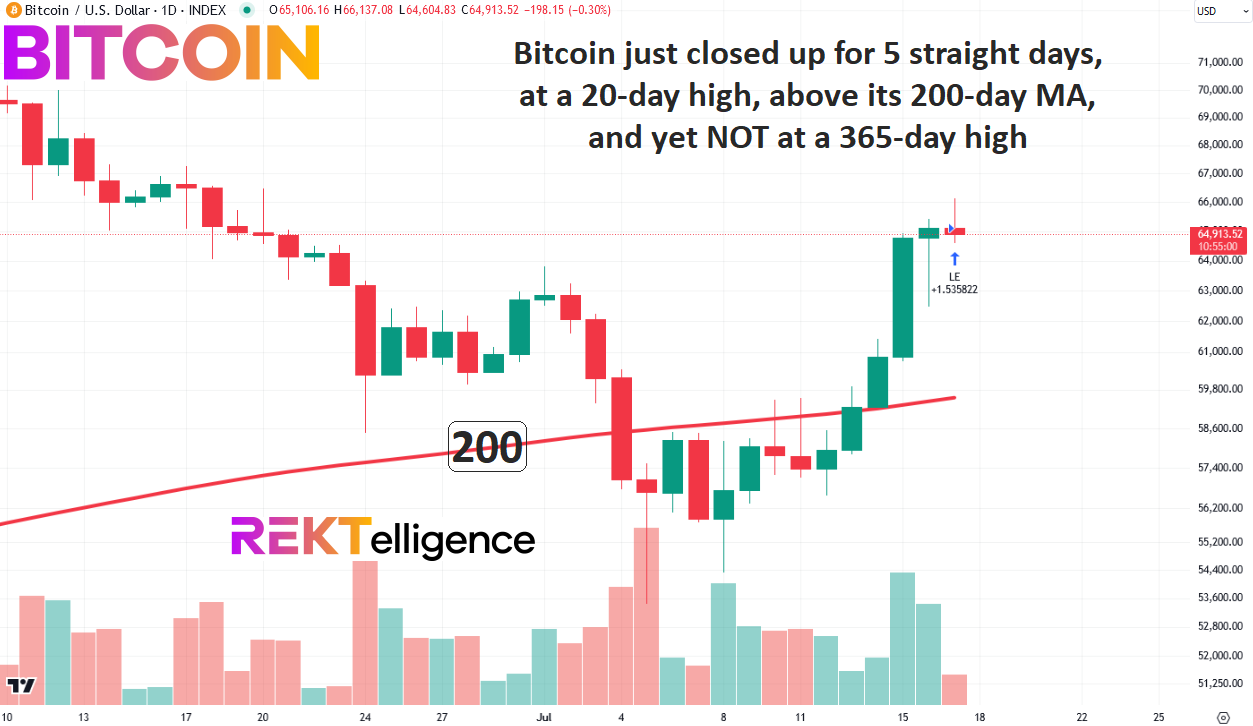
Roughly one week later, we’ve seen Bitcoin’s price gain nearly $10,000 as it moves back to within striking distance of the all-time high set in March.
Today’s report takes the conditions of this new surge into consideration, looking at past instances when Bitcoin has closed up for 5 straight days, at a 20-day high, above its 200-day MA, and yet not at a 365-day high.
Let’s get to the stats!
BITCOIN (BTC/USD). Daily Chart with Today’s Query Conditions
To take a closer look at the future implications of the current setup, we need to run a simple test over all of Bitcoin’s reliable history from 2011 to the present. Our “query conditions” represent a basic definition of the technical state of BTCUSD. The simpler the conditions the more data points we get to consider (three conditions is our typical max, though occasioally we include more when required).
First, our simple query conditions with a 90-day hold:
BITCOIN SETUP CONDITIONS

CONDITION 1: Bitcoin closes higher for 5 straight days
CONDITION 2: Bitcoin closes at a 20-day high
CONDITION 3: Bitcoin closes above its rising 200-day moving average
CONDITION 4: Bitcoin did not close at a 365-day high


ENTRY AND EXIT CONDITIONS:

1. ENTRY CONDITION: Enter long ("buy") at the open of the next candle
2. EXIT CONDITION: Exit ("sell") 90-days laterSince 2011, Bitcoin has experienced these conditions 14 times — roughly once per year on average. On the chart below, we display all hypothetical trades since 2011, shown with a 90-day hold time. The dates below correspond to the hypothetical EXIT DATE of the setup (i.e., 90 days after the setup conditions have been met).
BITCOIN (BTC/USD). Today’s Conditions: All Trades w/ 90-day Hold. 2011-Now.
The largest gain under current conditions occurred in 2011 — the early outlier of +1272% — while the largest loss of -46.67% occurred during the brutal 2014 bear market. While Bitcoin’s early years saw the greatest gains, the most recent trade of +253.84% was the second largest ever under these conditions and occurred in January of 2021. Notably, this huge gain was relatively near the start of the 2021 bull cycle run to new highs.
With only 3 closed losses to date using our conditions, Bitcoin has gained following this setup precisely 78.57% of the time using a 90-day exit.
Now let’s throw out the 2011 outlier from Bitcoin’s early history and get an arguably more realistic look at what we might expect going forward.
BITCOIN (BTC/USD). All Trades w/ 90-day Hold, EXCLUDING OUTLIER. 2011-Now.
Tossing out 2011’s outsized trade of +1272%, the average trade drops down to +76% using the same 90-day hold time.
That said, a 76% gain from Bitcoin’s current level of $65,188 (intraday July 17th, 2024) would put Bitcoin at $114,730 by mid-October 2024.
Interestingly — though not statistically significant — the few losses under these conditions have moderated over time, growing less punishing from 2014’s -46.67% and -29.50%, to May 2020’s relatively sedate -6.24%.
Unlike the diminishing magnitude of losses over time, however, Bitcoin’s ability to deliver multiple gains exceeding 200% under these conditions — 2011, 2013, 2018, and 2021 — has arguably not ebbed whatsoever.
Any trader knows that markets can do anything at any time, no matter how strong one’s convictions. This fact is inescapable, and often inconvenient.
But the stats here are compelling, extremely bullish, and so we HODL on.
Until next time…
peace_love_crypto-DB
IMPORTANT DISCLAIMER
The information presented and made available in this newsletter is intended for educational purposes only. THE INFORMATION IS NOT AND SHOULD NOT BE CONFUSED WITH INVESTMENT ADVICE AND DOES NOT ATTEMPT OR CLAIM TO BE A COMPLETE DESCRIPTION OF ANY SPECIFIC COINS, TOKENS OR MARKETS OF ANY KIND, BUT RATHER EDUCATIONAL EXAMPLES OF THE APPLICATION OF TECHNICAL ANALYSIS AND QUANTITATIVE ANALYSIS TO THE MARKET. This information has been presented and prepared without regard to any particular person's investment objectives, financial situation and particular needs because as individuals come from diverse backgrounds, with diverse objectives and financial situations. This information is of a general nature only so you should seek advice from your investment advisor or other financial professional as appropriate before taking any action. The opinions and analyses included herein are based on sources and data believed to be reliable and are presented in good faith, however no representation or warranty, expressed or implied is made as to their completeness or accuracy. It is imperative to understand your investment risks since all stock investments involve significant risk. The user of REKTelligence’s newsletters, podcasts, courses, coaching and other educational services agrees to indemnify and hold harmless REKTelligence LLC from and against any and all liabilities, expenses (including attorney's fees), and damages arising out of claims resulting from the use of this educational content. REKTelligence LLC is not a licensed investment advisor.
© 2024 REKTelligence LLC


