IN TODAY’S REPORT
What we cover: TECHNICAL ANALYSIS Edition. HODLer concerns? Altcoin Index stalls. Bitcoin makes a 365-day high from a tight range. More in 2025?
Today’s Key Charts
BALANCE OF ASSETS BELONGING TO HODLERS. Daily Chart. IntoTheblock data.
It’s time to add this chart to my daily routine. Why? Every cycle sees Bitcoin HODLers — those holding Bitcoin for at least one year — begin to reduce their holdings as the cycle progresses.
For example, by late 2017 / early 2018 Bitcoin HODLers had lightened their holdings by approximately 27% as Bitcoin surged to a cycle peak in around 20,000. In other words, once a HODLer moves Bitcoin from one address to another, the HODLer ceases to be a HODLer and the percentage of assets belonging to HODLers declines.
In the prior cycle, the 2021 Bitcoin top occurred after the percentage of assets belonging to HODLers fell roughly 15%. Currently, the percentage of assets belonging to BTC HODLers has dropped about 12%. So are we close to a top? Maybe, but a few points need to be considered.
Last cycle was arguably cut short by macro headwinds and generational inflation combined with one of the most aggressive FOMC rate cut cycles ever. Additionally, this cycle has seen the percentage of assets belonging to HODLers fall at the same time as the Grayscale Bitcoin Trust became an ETF and new lower fee spot BTC ETFs came into existence, leading many HODLers to shift vehicles (i.e., move addresses and cease to be HODLers, though not necessarily to sell). This dynamic wasn’t even a possibility in older cycles.
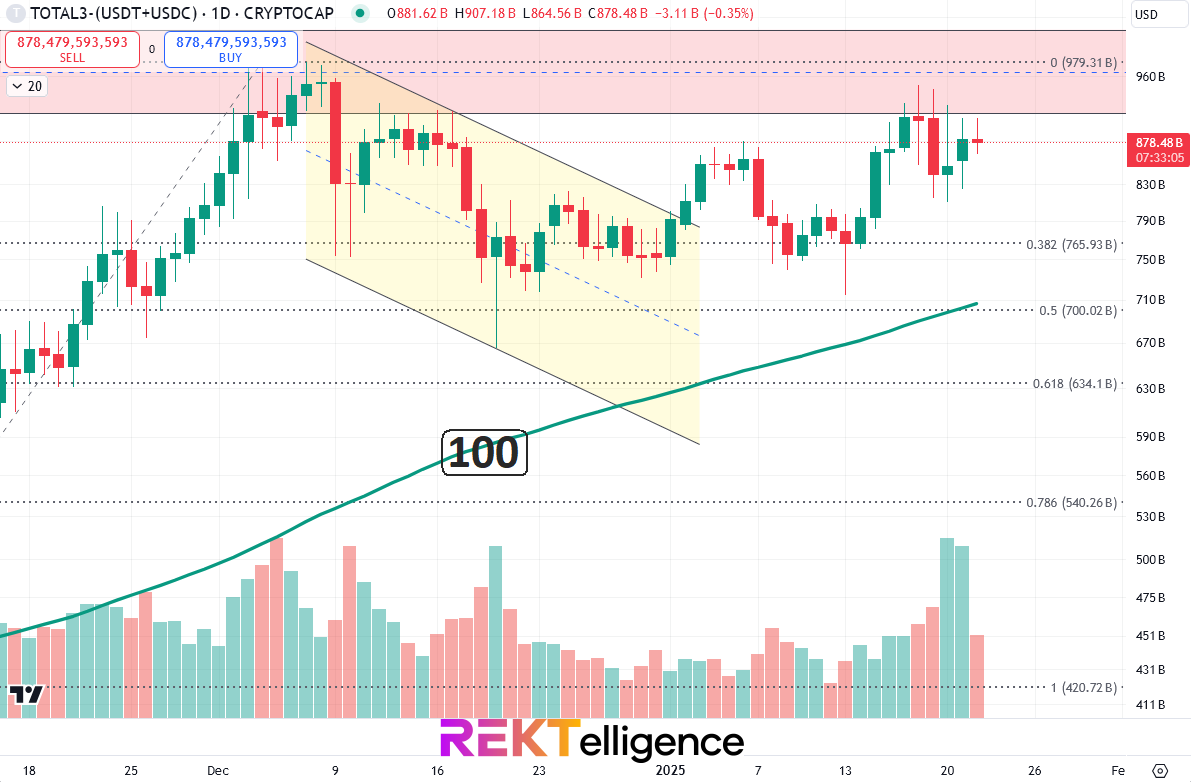
TAKEAWAY: The percentage of assets belonging to BTC HODLers will likely decline more than last cycle's 15% and probably see a decline of 20% or more, closer to the 2017 cycle. ALTCOIN INDEX. Total Crypto Market Cap minus $BTC, $ETH, $USDT, $USDC.
As shown before, the Altcoin Index takes all the money invested in crypto and subtracts the collective market cap of Bitcoin and Ether along with stablecoins Tether and USD Coin.
As Bitcoin pushed to an incrementally new all-time high this week, the Altcoin Index stalled at resistance (see red shading), an area where it stalled in 2021, in late 2024, and again right now.
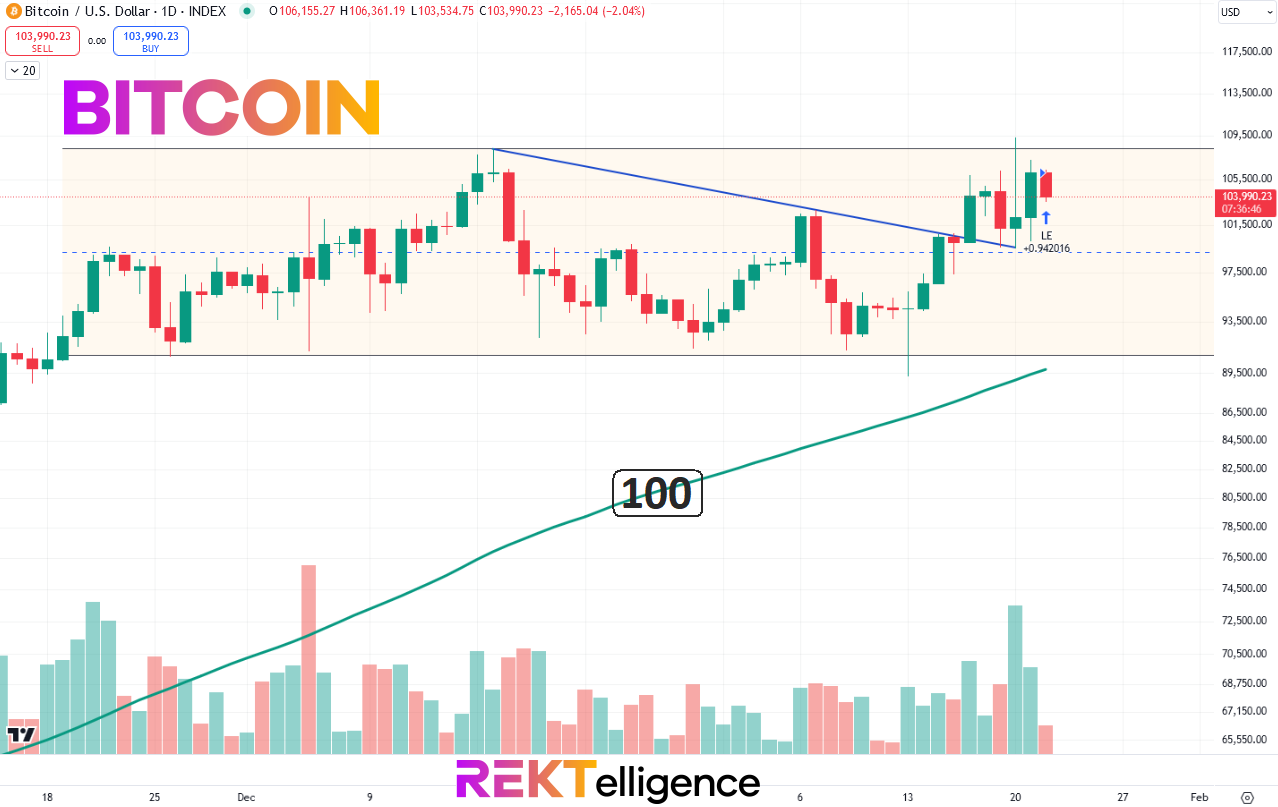
TAKEAWAY: Any potential altcoin frenzy will require broader crypto market participation. In other words, it will require the Altcoin Index to break above the resistance area and achieve a market cap north of $1 Trillion. This could potentially happen within days to weeks.BITCOIN (BTCUSD). Daily Chart with New 365-Day High and 100ma.
Bitcoin just made a new 365-day high out of a narrow 30-day trading range of <= 13% from high to low. This has happened only 6 times in its history (2011 - present) with an average trade of 20.9% using a 30-day hold time.
TAKEAWAY: For the quants out there, the Profit Factor = 19.52 on this query, an impressive metric even considering the small number of instances.While the percentage of assets belonging to Bitcoin HODLers has declined notably, there’s likely much more in the tank for 2025. Apart from a bullish short-term BTC query and a compelling Altcoin Index chart, we’re simply not seeing the myriad “exit indications” which typically accompany most cycle tops.
Until next time…
peace_love_crypto-DB
IMPORTANT DISCLAIMER
The information presented and made available in this newsletter is intended for educational purposes only. THE INFORMATION IS NOT AND SHOULD NOT BE CONFUSED WITH INVESTMENT ADVICE AND DOES NOT ATTEMPT OR CLAIM TO BE A COMPLETE DESCRIPTION OF ANY SPECIFIC COINS, TOKENS OR MARKETS OF ANY KIND, BUT RATHER EDUCATIONAL EXAMPLES OF THE APPLICATION OF TECHNICAL ANALYSIS AND QUANTITATIVE ANALYSIS TO THE MARKET. This information has been presented and prepared without regard to any particular person's investment objectives, financial situation and particular needs because as individuals come from diverse backgrounds, with diverse objectives and financial situations. This information is of a general nature only so you should seek advice from your investment advisor or other financial professional as appropriate before taking any action. The opinions and analyses included herein are based on sources and data believed to be reliable and are presented in good faith, however no representation or warranty, expressed or implied is made as to their completeness or accuracy. It is imperative to understand your investment risks since all stock investments involve significant risk. The user of REKTelligence’s newsletters, podcasts, courses, coaching and other educational services agrees to indemnify and hold harmless REKTelligence LLC from and against any and all liabilities, expenses (including attorney's fees), and damages arising out of claims resulting from the use of this educational content. REKTelligence LLC is not a licensed investment advisor.
© 2025 REKTelligence LLC


