IN TODAY’S REPORT
What we cover: TECHNICAL ANALYSIS Edition. Costa Rica. This crypto season. Fear and Greed Index. TOTAL3. Dollar Index. Patience, prudence, and a brightening sky.
Bridges Overhead
The last time I visited Costa Rica, the myriad layers of bridges — some merely ropewalks or similar — were striking, primarily because they were arranged some 50 to 100 feet above the roof of the car taking us from Nosara back to the capital San José.
The driver explained that these were needed during the annual rainy season — or so-called “green season” — when the road we were on was either under water, or had the terrifying potential to be within just minutes of the first heavy raindrop,
The memory of looking straight up at an entirely different seasonal “regime” of existence has stayed with me.
Those who’ve lived through only one complete crypto cycle usually just have a Wallet of Shame to show for it. Few end up with Lambos, regrettably, at least not on the first go-round.
While the Bitcoin-driven four-year cycle has reigned over the cryptoverse since its inception, it’s naturally not a given moving forward. While this rigid cyclicality may not last, the alternating “seasons” of Bitcoin and the larger crypto market will likely persist, even if their length and order changes.
In this Technical Analysis Edition, I look at three charts relevent to the current season, with its mix of moderate temperatures and overcast skies, muted hope and gnawing dread. As we’ll see, there may just be a ray or two of light breaking through.
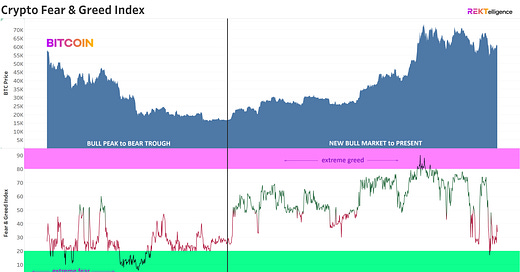
BITCOIN (BTCUSD). Daily Chart w/ Crypto Fear & Greed Index. Nov 2021 - Now.
The Crypto Fear & Greed Index recently fell back into the extreme fear range, dipping below the 20 level for the first time since July 15, 2022 — arguably the start of the bear market, or at least when many rekt crypto believers first put their heads in their hands in resignation.
The recent monsoon of sell pressure, however, may have just washed out the over-leveraged among us. Yes, there are actually people who choose to employ leverage on the most volatile asset class which has ever existed. Pity the fool.
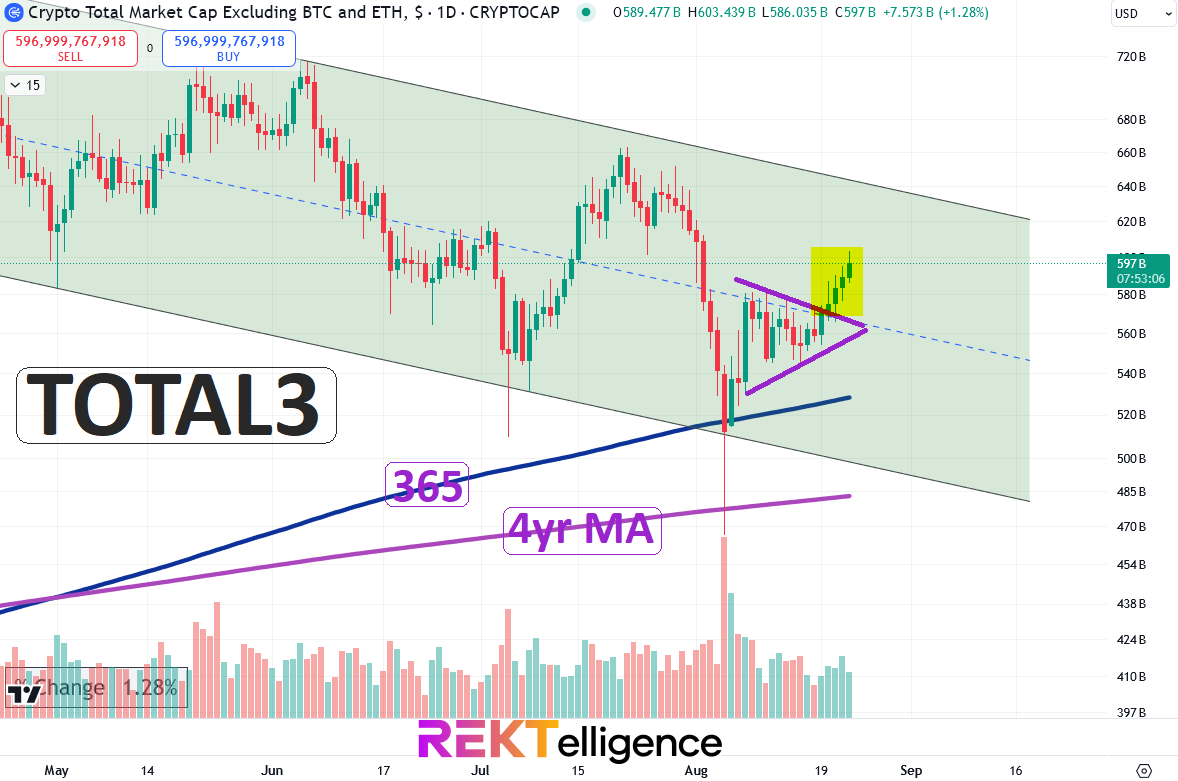
TAKEAWAY: The upshot? This recent brutal washout and first dip below 20 in over two years may just be the cleansing the market needed, preparing the way for new entrants with longer time horizons. TOTAL3. Daily Chart (IntoTheBlock Data) w/ 365ma & 4-year MA. May 2024 - Now.
Showing all crypto market cap excluding Bitcoin and Ether, TOTAL3 just tested its 365ma and 4-year ma on the same day before recovering to consolidate in a small wedge pattern.
TOTAL3 just achieved liftoff from this small wedge earlier this week, and may now be quietly stair-stepping its way up toward the top of its months-long channel.
TAKEAWAY: Altcoins are further out on the risk curve, and have experienced their own 2024 bear market while Bitcoin has simply consolidated relatively near its all-time high. With rate cuts on the horizon, alts now show signs of life and may soon surprise to the upside. U.S. Dollar Index (DXY). Daily Chart. May 2024 - Now.
The semi-inverse correlation between Bitcoin and the U.S Dollar Index may be another factor bolstering the awakening of select alts in recent days.
TAKEAWAY: While the BTC vs DXY inverse relationship was highly evident in the last bull cycle (2020-2021), it's overated in my view. That said, a declining dollar may be one less headwind for Bitcoin and the wider alt space as we head toward a more seasonally favorable period in late October / November. Few enjoy this crypto season, with its occasional monsoons and torturous swings to nowhere. But I’ll be sticking to the upper walkways and elevated bridges, one hand on the rail and one eye on the weather. Patience and prudence rule the day, friends, even as the sky grows a bit brighter.
Until next time…
peace_love_crypto-DB
IMPORTANT DISCLAIMER
The information presented and made available in this newsletter is intended for educational purposes only. THE INFORMATION IS NOT AND SHOULD NOT BE CONFUSED WITH INVESTMENT ADVICE AND DOES NOT ATTEMPT OR CLAIM TO BE A COMPLETE DESCRIPTION OF ANY SPECIFIC COINS, TOKENS OR MARKETS OF ANY KIND, BUT RATHER EDUCATIONAL EXAMPLES OF THE APPLICATION OF TECHNICAL ANALYSIS AND QUANTITATIVE ANALYSIS TO THE MARKET. This information has been presented and prepared without regard to any particular person's investment objectives, financial situation and particular needs because as individuals come from diverse backgrounds, with diverse objectives and financial situations. This information is of a general nature only so you should seek advice from your investment advisor or other financial professional as appropriate before taking any action. The opinions and analyses included herein are based on sources and data believed to be reliable and are presented in good faith, however no representation or warranty, expressed or implied is made as to their completeness or accuracy. It is imperative to understand your investment risks since all stock investments involve significant risk. The user of REKTelligence’s newsletters, podcasts, courses, coaching and other educational services agrees to indemnify and hold harmless REKTelligence LLC from and against any and all liabilities, expenses (including attorney's fees), and damages arising out of claims resulting from the use of this educational content. REKTelligence LLC is not a licensed investment advisor.
© 2024 REKTelligence LLC


