


Ethereum Will Now Outperform
What The Data Says When ETHBTC Gets Smoked

IN TODAY’S REPORT
What we cover: ETHBTC’s weak performance defined. Implications for ETH.
TODAY’S STATS
Chartists Are Rarely Objective
ETH/BTC just got smoked.
Down for days and pounded in Monday’s session, the most important ratio in all of crypto looks ugly. Time to dump Ethereum for Bitcoin? More than a few well-known analysts would say yes.
But chartists are rarely objective. I’ve been one for more than a couple decades, so I should know. It wasn’t until I pivoted to be primarily stats-driven, however, that chart setups became measurable, probability drove decision-making, and objectivity emerged as a new reality.
Today we’ll define the current ETH/BTC setup, query the data and see what the hell it says about this late 2023 see-saw market.
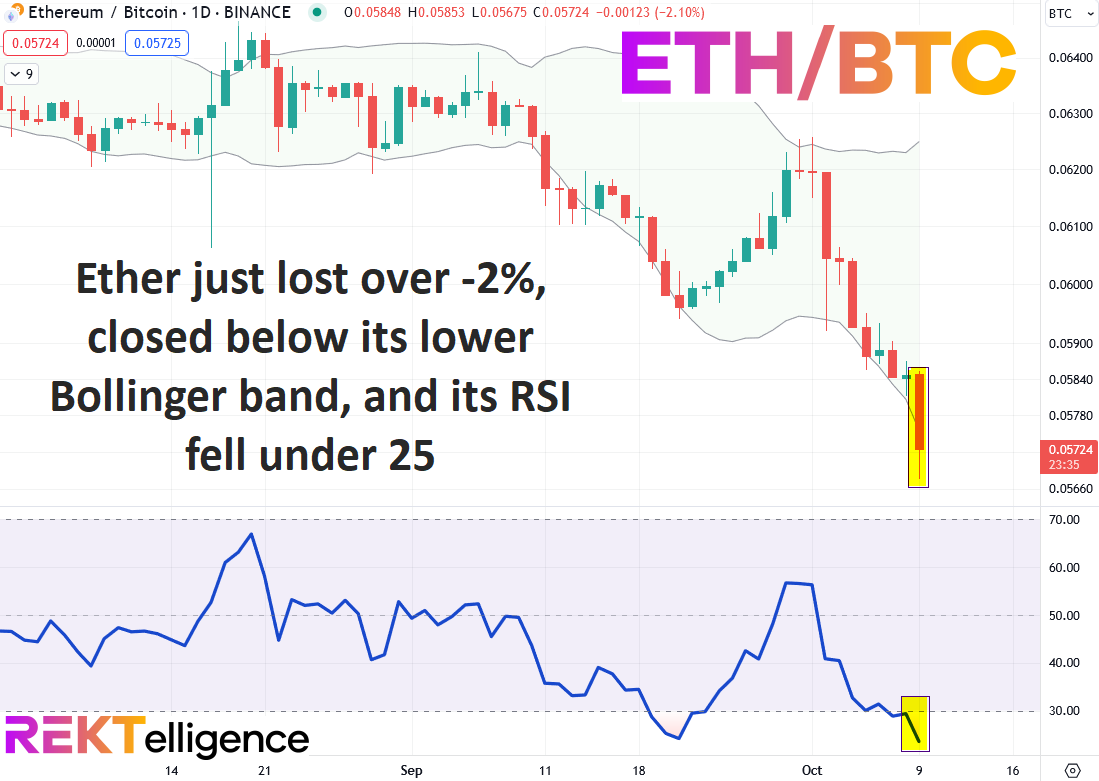
ETHEREUM/BITCOIN (ETH/BTC). Daily Chart with Bollinger bands and RSI(14).
To take a closer look at the future implications of the current setup, we’ll run a simple test over all of ETH/BTC’s history from inception to the present. Our “query conditions” represent a basic definition of the technical state of ETH/BTC. The simpler the conditions the more data points we get to consider.
First, our simple query conditions below:
ETH/BTC SETUP CONDITIONS

CONDITION 1: ETH/BTC closes lower by 2.00% or more
CONDITION 2: ETH/BTC closes below its lower Bollinger band
CONDITION 3: ETH/BTC's RSI(14) closes below 25


ENTRY AND EXIT CONDITIONS:

1. ENTRY CONDITION: Enter long ("buy") at the open of the next candle
2. EXIT CONDITION: Exit ("sell") N-days later
When we run our test over ETHBTC’s historical data, we get these results using a variety of hold times. For those new to our work, here’s a quick guide:
Win %: This shows the percentage of hypothetical trades which were profitable when exited “N-Days” later. For example, if someone bought ETH/BTC each time all today’s query conditions were met in the past and exited 60 days later, Win % shows how many of those trades with have been profitable.
Average Trade %: Shows the average trade result for various hypothetical hold times (i.e., for a 30-day hold, 60-day hold, 90-day hold, 180-day hold, and a 365-day hold).
ETHEREUM/BITCOIN (ETH/BTC). Average Trade Over Various Hold Times. Inception-Now.

Across all hold times, average trade results for ETH/BTC are positive with only one exception — a 60-day hold. Average trade results remain relatively similar through 90 days. With a 180-day exit however, the average trade jumps massively to +190.7%. One year hold? Even better at +250.2%.
Exit 7 days later? +7.4% average trade
Exit 15 days later? +9.4% average trade
Exit 30 days later? +17.6% average trade
Exit 60 days later? -0.6% average trade
Exit 90 days later? +18.8% average trade
Exit 180 days later? +190.7% average trade
Exit 365 days later? +250.2% average trade
The Win % here provides the nuance. All hold times through 30 days have a positive average trade but winning percentages mostly under 50%. Therefore we can expect mixed performance in the short-term. More specifically, odds are for ETH/BTC weakness over short-term hold times, but nevertheless a positive expectation.
What’s the upshot? Over the next 30 days, chances are lower for a positive result, but the magnitude of positive results > the magnitude of negative results. This is good.
Beyond 30 days, Win % improves dramatically. While most traders will now double-down on their belief that it’s Bitcoin’s time to shine, the data suggests otherwise. If the data holds, probability suggests that Ethereum will now outperform.
peace_love_crypto-DB

IMPORTANT DISCLAIMER
The information presented and made available in this newsletter is intended for educational purposes only. THE INFORMATION IS NOT AND SHOULD NOT BE CONFUSED WITH INVESTMENT ADVICE AND DOES NOT ATTEMPT OR CLAIM TO BE A COMPLETE DESCRIPTION OF ANY SPECIFIC COINS, TOKENS OR MARKETS OF ANY KIND, BUT RATHER EDUCATIONAL EXAMPLES OF THE APPLICATION OF TECHNICAL ANALYSIS AND QUANTITATIVE ANALYSIS TO THE MARKET. This information has been presented and prepared without regard to any particular person's investment objectives, financial situation and particular needs because as individuals come from diverse backgrounds, with diverse objectives and financial situations. This information is of a general nature only so you should seek advice from your investment advisor or other financial professional as appropriate before taking any action. The opinions and analyses included herein are based on sources and data believed to be reliable and are presented in good faith, however no representation or warranty, expressed or implied is made as to their completeness or accuracy. It is imperative to understand your investment risks since all stock investments involve significant risk. The user of REKTelligence’s newsletters, podcasts, courses, coaching and other educational services agrees to indemnify and hold harmless REKTelligence LLC from and against any and all liabilities, expenses (including attorney's fees), and damages arising out of claims resulting from the use of this educational content. REKTelligence LLC is not a licensed investment advisor.
© 2023 REKTelligence LLC