


Ethereum: Beyond A Genslered Market
The Summer 2023 Crypto Slump Still Suggests A Pending Rally

IN TODAY’S REPORT
What we cover: Ether makes 90-day low above its 365ma. Holding time stats. All trades using a 60-day exit. Permissionless 2023!
TODAY’S STATS
Compelling Stats for Ether Right Now
Bitcoin fades. Ether slumps. The summer 2023 grind continues.
Despite the innumerable positives from Grayscale’s victory to the impressively backed-up ETH staking queue, the Cryptosphere is still getting Genslered. And that ain’t pretty, at least in the short-term.
Time to pull the ripcord?
Before you bail on the whole goddamn affair, consider the stats below. Above and beyond the emotional toll of the two most innovative assets in the world bleeding slowly to the downside day after day despite continued network adoption, there’s a silver satoshi lining:
Ethereum just closed at a 90-day low and is above its one-year moving average (365ma). Who cares? Read on.
ETHEREUM (ETH/USD). Daily Chart with One-Year Moving Average (365ma).

To take a closer look at the future implications of the current setup, we’ll run a simple test over all of Ethereum’s history from inception to the present. Our “query conditions” represent a basic definition of the technical state of ETHUSD. The simpler the conditions the more data points we get to consider.
First, our simple query conditions below:
ETHER's SETUP CONDITIONS

CONDITION 1: Ether closes at a 90-day low
CONDITION 2: Ether closes above its 365-day (one year) moving average


ENTRY AND EXIT CONDITIONS:

1. ENTRY CONDITION: Enter long ("buy") at the open of the next candle
2. EXIT CONDITION: Exit ("sell") N-days later
When we run our test over Ether’s historical data, we get these results using a variety of hold times. For those new to our work, here’s a quick guide:
Win %: This shows the percentage of hypothetical trades which were profitable when exited “N-Days” later. For example, if someone bought Bitcoin each time all today’s query conditions were met in the past and exited 60 days later, Win % shows how many of those trades with have been profitable.
Average Trade %: Shows the average trade result for various hypothetical hold times (i.e., for a 30-day hold, 60-day hold, 90-day hold, 180-day hold, and a 365-day hold).
ETHER (ETH/USD). Average Trade Results Over Various Hold Times. Inception-Now.

As noted in the image above, anytime in Ethereum’s history when ETH has closed at a 90-day low while above its one-year moving average (365ma), the average trade has been positive for all of the holding times (exits) which we examine.
Exit 30 days later? +9.1% average trade
Exit 60 days later? +19.7% average trade
Exit 90 days later? +22.5% average trade
Exit 180 days later? +181.7% average trade
Exit 365 days later? +955.8% average trade. Not a typo.
Not all trades are winners of course. In fact, using a 365-day exit, only one of the three trades has been a winner. Still, an average trade of over 950%. Very Ethereum.
Now let’s turn our focus to a short-term holding period of 60 days. Below are the hypothetical trade results for every time we’ve seen these query conditions in ETHUSD’s history.
ETHER (ETH/USD). Trades History with a 60-Day Holding Time. Inception-Now.
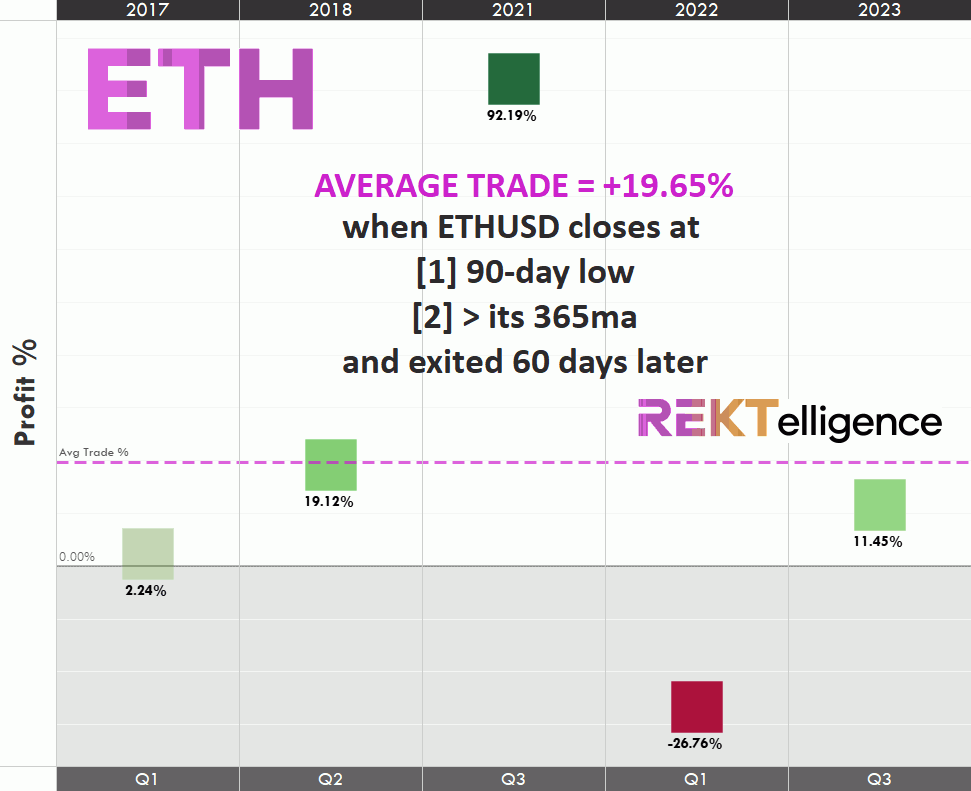
The 60-day hold following Ether’s current conditions have an average trade of +19.65% with just a single loss. Impressive. With only five data points can we call this setup a no-questions slam dunk trade? No, of course not. But it’s what we’ve got to work with, and the stats are solidly positive.
Beyond the Genslered market — a regulatory pandemic-like condition of sorts, and one which will eventually pass — there’s the inevitability of Ethereum.
More specifically and near-term, the stats are positive every way we slice them.
PERMISSIONLESS 2023!
Join Me At Permissionless 2023 in Austin TX…
Any fellow Permissionless attendees? Email me at rektelligence@proton.me or leave a comment and we’ll look to connect!
HEY THERE! THANKS FOR READING. Please feel free to *SHARE* this report! We appreciate you spreading the word so we can continue to deliver this research. Cheers, DB
peace_love_crypto-DB

IMPORTANT DISCLAIMER
The information presented and made available in this newsletter is intended for educational purposes only. THE INFORMATION IS NOT AND SHOULD NOT BE CONFUSED WITH INVESTMENT ADVICE AND DOES NOT ATTEMPT OR CLAIM TO BE A COMPLETE DESCRIPTION OF ANY SPECIFIC COINS, TOKENS OR MARKETS OF ANY KIND, BUT RATHER EDUCATIONAL EXAMPLES OF THE APPLICATION OF TECHNICAL ANALYSIS AND QUANTITATIVE ANALYSIS TO THE MARKET. This information has been presented and prepared without regard to any particular person's investment objectives, financial situation and particular needs because as individuals come from diverse backgrounds, with diverse objectives and financial situations. This information is of a general nature only so you should seek advice from your investment advisor or other financial professional as appropriate before taking any action. The opinions and analyses included herein are based on sources and data believed to be reliable and are presented in good faith, however no representation or warranty, expressed or implied is made as to their completeness or accuracy. It is imperative to understand your investment risks since all stock investments involve significant risk. The user of REKTelligence’s newsletters, podcasts, courses, coaching and other educational services agrees to indemnify and hold harmless REKTelligence LLC from and against any and all liabilities, expenses (including attorney's fees), and damages arising out of claims resulting from the use of this educational content. REKTelligence LLC is not a licensed investment advisor.
© 2023 REKTelligence LLC