ETH Bulls Should Welcome Today's Selloff
The stats behind today's ETH drop to a likely 7-day low look solidly bullish
TODAY’S STATS
ETH’s Selloff May Be Just What the Sidelined Bulls Needed
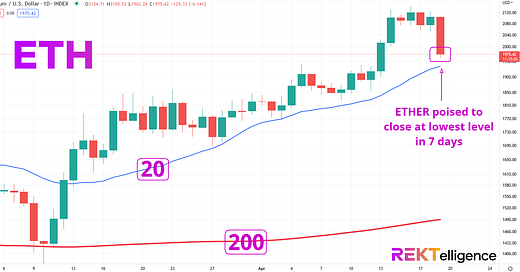
After three straight weeks of gains, Ether is selling off hard in today’s session and now looks poised to close at its lowest level in a week. Today’s candle has also torn unceremoniously through the 2000 whole round number support in the process. An ugly candle doesn’t exist in a vacuum, however, and context is critical, especially in financial markets where behavioral biases create dependency within the time series.
ETHER (ETH/USD). Daily Chart with 20ma and 200ma.
We’ll focus our stats around ETH’s highly probable close at a 7-day low, applying a couple moving averages as context. The fact that today’s selloff is occurring above the 20ma and 200ma typically indicates that the bearish action is taking place within an uptrend, and we’ll include these as conditions.
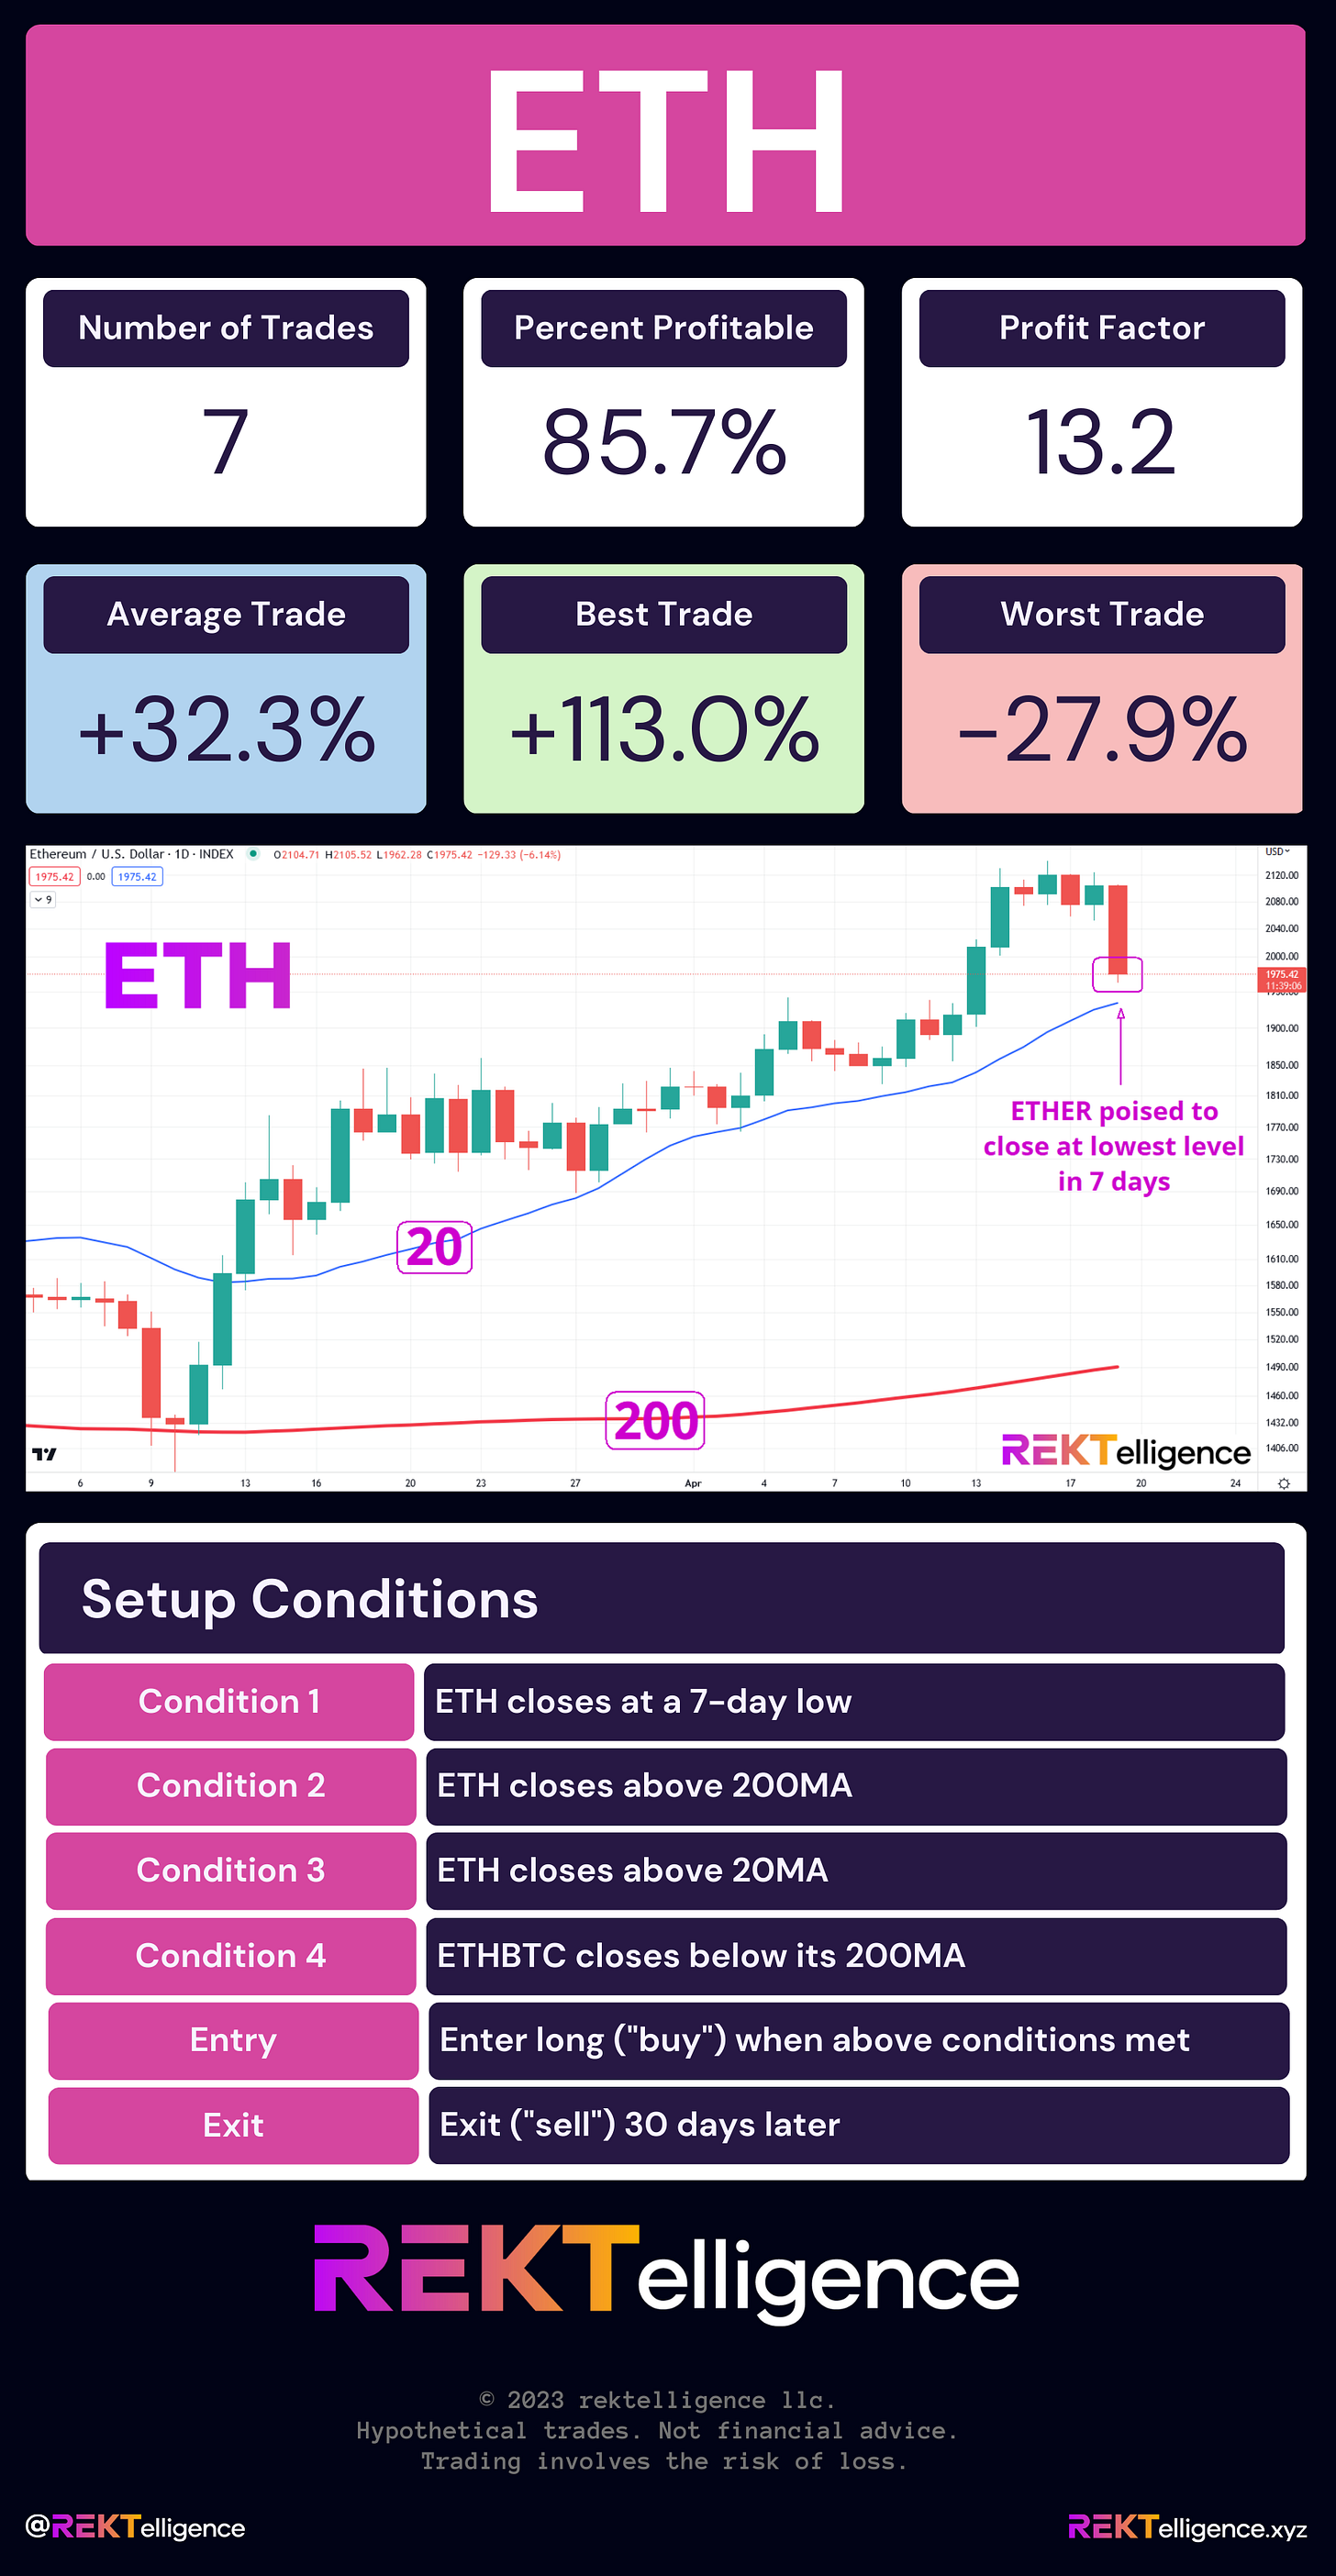
Our initial query’s setup conditions:

1. ETH closes at a 7-day low

2. ETH closes above its 200MA

3. ETH closes above its 20MA
Here are the results using a 30-day hold:
ETHER (ETH/USD). Query Results for ETH with a 30-day Hold. Inception - Present.
The 26 historical occurrences have been profitable nearly two thirds of the time with an average trade of +29.7% over a 30-day period. The disparity between a hypothetical best trade of over +350% and a worst trade of -48.7% is somewhat concerning, however. As always, anything is possible in risk markets - crypto in particular - so traders must prepare for any outcome. That said, a profit factor of 2.68 on 26 trades is impressive, indicating a tendency for these conditions to produce gross gains over 2.5 times that of gross losses over a 30-day period. We view profit factors of 2.0 or higher on this many trades as favorable
Now let’s look at results for Average Gain and Average Loss across various holding times ranging from 7-days to a year. Note that the Win % shows how many trades were profitable, hypothetically speaking.
ETHER (ETH/USD). Holding Time Results for Today’s Conditions. Inception- Now.
While the average gain for one-year hold is undoubtedly impressive at +853.8%, the win rate is the lowest of the holding times at only 50% - a coin flip. For hold times of 7 days to 30 days, the average gain is slightly better than twice the average loss. While this improves with hold times of 90 days to 365 days, let’s explore another current condition to further refine these results.
For most of 2023, we’ve seen ETHBTC continue to close below its 200ma as Bitcoin has outpaced Ether with a powerful surge off the 2022 lows and amid a rapidly unfolding fiat banking crisis in Q1. Since ETHBTC often acts as a barometer within the crypto market (more on that in a future letter), we’ll add the fact that ETHBTC is currently below its 200ma as fourth condition.
Our refined query’s setup conditions:

1. ETH closes at a 7-day low

2. ETH closes above its 200MA

3. ETH closes above its 20MA

4. ETHBTC closes below its 200MA
Here are the results when we add the ETHBTC < 200ma condition:
ETHER (ETH/USD). Results with extra condition and 30-day Hold. Inception - Now.
While the average gain is about the same as before, the Win % is significantly higher at 85.7% using the same 30-day hold.
As we examine additional holding times, note that the average loss is now significantly improved and Win % even more impressive. In fact, looking at 7 days through 180 days, four of the five hold periods have Win % rates of 80% or higher. The recent ETHBTC underperformance (i.e., below its 200ma) only helps ETH’s prospects under today’s conditions.
ETHER (ETH/USD). Holding Time Results with ETHBTC Condition. Inception - Now.
THE TECHNICAL VIEW
Monthly Supply Zone Looms Large
While we have a Ether focus today, we’ll reiterate our current technical view from Monday. Our “expect turbulence and possible treachery in this area” statement seems on point in light of today’s sharp downside:
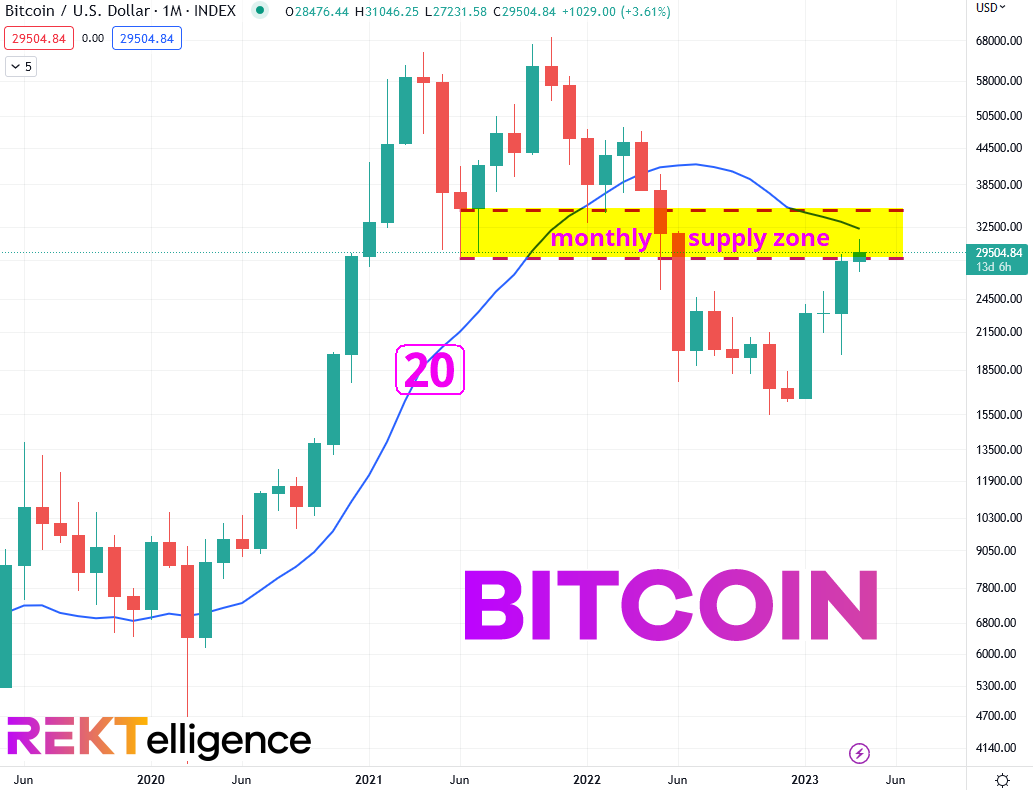
Bitcoin’s 20-month moving average has historically acted as a brutal technical dividing line between bull and bear periods with the coldest parts of all past crypto winters occurring below it. On the flip side, when Bitcoin has regained the average by closing above it at month end, many of the hottest rallies in its brief but storied history have subsequently caught fire.
BITCOIN (BTC/USD). Monthly Chart with 20-month SMA.
While Bitcoin now fast approaches this critical moving average - a positive - we’re not expecting the bears to roll over without a fight in this area. Specifically, the area of concern is the monthly supply zone between 28,750 and 34,830. Several prior lows, the declining 20-month moving average, and the opening of the emotionally-charged bearish controlling candle of June 2022 all reside in this important supply zone. Expect turbulence and possible treachery in this area. Bitcoin could easily hit rough air soon.
THE TLDR
A Few Key Takeaways
✔ ETH's selloff occurs within an uptrend - important context for today's weakness
✔ The stats around today's basic conditions are solidly bullish
✔ When factoring ETHBTC's relative underperformance, stats improve meaningfully
✔ The 365-day hold shows impressive gains but with a poor Win % (i.e., a coin flip)
peace_love_crypto-DB
IMPORTANT DISCLAIMER
The information presented and made available in this newsletter is intended for educational purposes only. THE INFORMATION IS NOT AND SHOULD NOT BE CONFUSED WITH INVESTMENT ADVICE AND DOES NOT ATTEMPT OR CLAIM TO BE A COMPLETE DESCRIPTION OF ANY SPECIFIC COINS, TOKENS OR MARKETS OF ANY KIND, BUT RATHER EDUCATIONAL EXAMPLES OF THE APPLICATION OF TECHNICAL ANALYSIS AND QUANTITATIVE ANALYSIS TO THE MARKET. This information has been presented and prepared without regard to any particular person's investment objectives, financial situation and particular needs because as individuals come from diverse backgrounds, with diverse objectives and financial situations. This information is of a general nature only so you should seek advice from your investment advisor or other financial professional as appropriate before taking any action. The opinions and analyses included herein are based on sources and data believed to be reliable and are presented in good faith, however no representation or warranty, expressed or implied is made as to their completeness or accuracy. It is imperative to understand your investment risks since all stock investments involve significant risk. The user of REKTelligence’s newsletters, podcasts, courses, coaching and other educational services agrees to indemnify and hold harmless REKTelligence LLC from and against any and all liabilities, expenses (including attorney's fees), and damages arising out of claims resulting from the use of this educational content. REKTelligence LLC is not a licensed investment advisor.
© 2023 REKTelligence LLC


