


Dissecting Bitcoin's Slow But Steady Bleed
A Probabilistic Look At Bitcoin's 5 Straight Days Down

IN TODAY’S REPORT
What we cover: Bitcoin closes down for 5 straight days. Query conditions. Removing the outlier. Trades scatter.
TODAY’S STATS
Down Down Every Day Down
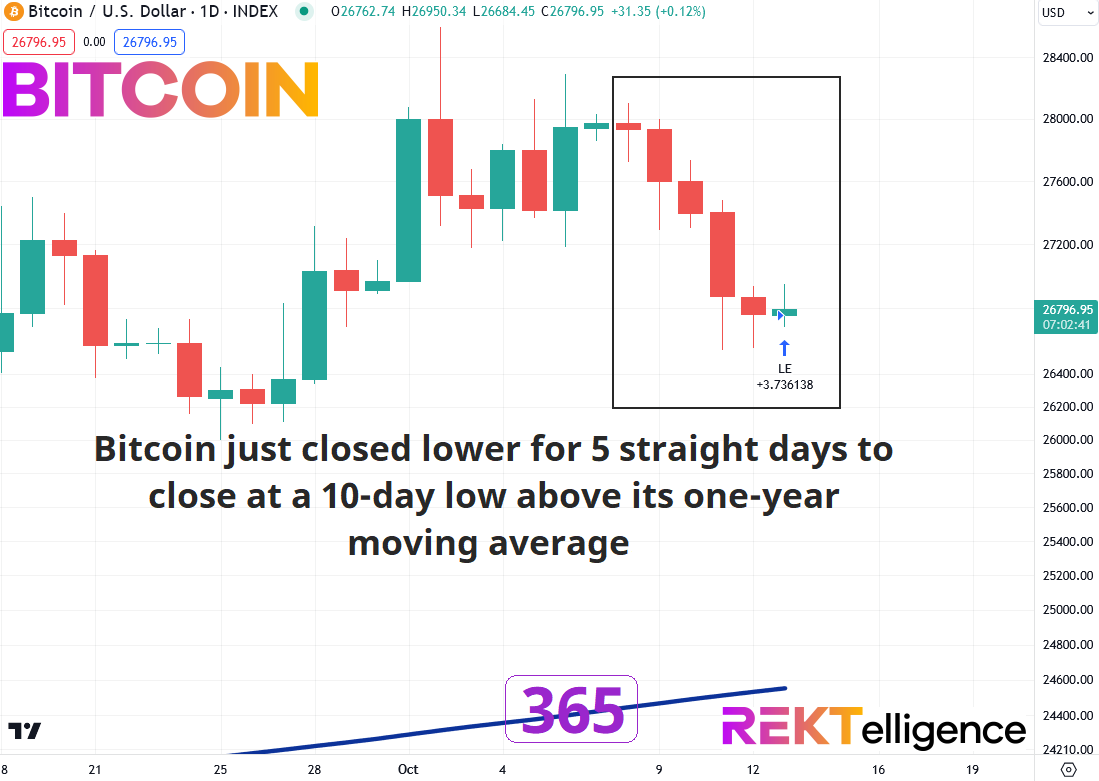
Sunday down. Monday down. Tuesday down. Wednesday down. Thursday down. Bitcoin’s slow but steady bleed feels heavier than its actual price impact. While the king crypto is down less than 5% over this five-day period, the monotony of the pullback weighs on the mind.
Today we examine all past scenarios analogous to this past week. Will we get any relief? Let’s dive in.
BITCOIN (BTC/USD). Daily Chart with One-Year Moving Average (365ma).
To take a closer look at the future implications of the current setup, we’ll run a simple test over Bitcoin’s reliable data history from 2011 to the present. Our “query conditions” represent a basic definition of the technical state of BTCUSD. The simpler the conditions the more data points we get to consider (three conditions is our typical maximum).
First, our simple query conditions below:
BITCOIN SETUP CONDITIONS

CONDITION 1: Bitcoin closes down for 5 straight days
CONDITION 2: Bitcoin closes at 10-day low
CONDITION 3: Bitcoin closes above its 365-day (one year) moving average


ENTRY AND EXIT CONDITIONS:

1. ENTRY CONDITION: Enter long ("buy") at the open of the next candle
2. EXIT CONDITION: Exit ("sell") N-days later
When we run our test over Bitcoin’s historical data, we get these results using a variety of hold times. For those new to our work, here’s a quick guide:
Win %: This shows the percentage of hypothetical trades which were profitable when exited “N-Days” later. For example, if someone bought Bitcoin each time all today’s query conditions were met in the past and exited 90 days later, Win % shows how many of those trades with have been profitable.
Average Trade %: Shows the average trade result for various hypothetical hold times (i.e., for a 7-day hold, 15-day hold, 30-day hold, 60-day hold, 90-day hold, 180-day hold, and a 365-day hold).
BITCOIN (BTC/USD). Average Trade Results Over Various Hold Times. 2011-Now.

Clearly — following this week’s slow but steady bleed — the short-term outlook for Bitcoin is only negligibly positive with each short-term hold time delivering a mere 1% on average. On an average trade basis, don’t expect much through mid-October.
Short-term Probabilities
Exit 7 days later? +1.0% average trade
Exit 15 days later? +1.2% average trade
Exit 30 days later? +1.2% average trade
Medium-term? What a difference 60 days makes. Hold times for 60, 90, and 180 days suggest significantly higher prices based on historical setups. We’ll take a closer look at the 90-day hold time in our scatter plot of trades below.
Medium-term Probabilities
Exit 60 days later? +47.1% average trade
Exit 90 days later? +151.2% average trade
Exit 180 days later? +114.6% average trade
Going out to a year, history has delivered an over +250% gain. While we should temper our expectations going forward, a year-out looks odds-on bullish with a 71% win rate.
Long-term Probability
Exit 365 days later? +273.6% average trade
Now let’s turn our focus to the medium-term holding period of 90 days. Below are the hypothetical trade results for every time we’ve seen these query conditions in Bitcoin, 2011 to now. For more a more conservative view, we’ve eliminated the 2011 outlier (i.e., excluding the single +2000% gain).
BITCOIN (BTC/USD). Trades History with a 90-Day Holding Time. 2011-Now.
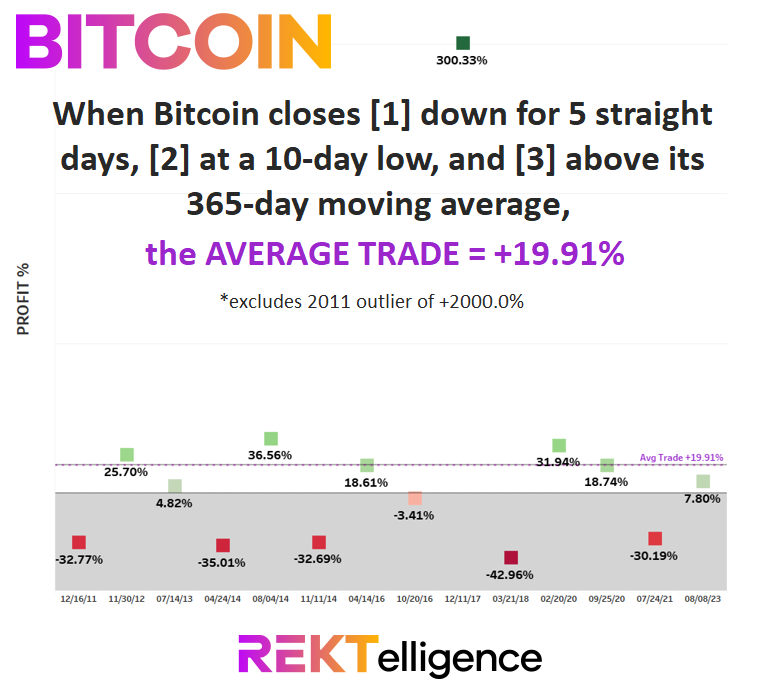
With only three trades in the single percentage digits (+4.82%, -3.41%, and +7.80%), all other trades have landed in seriously positive or negative territory. In short, the 90-day window following from this setup has seen immense variability.
That said, even eliminating the 2011 outlier of +2000%, the average trade comes in at +19.91% over 90 days — respectably positive.
But today’s query suggests that we’re sitting on a statistical precipice. The 90-day window has brought significant pleasure and pain in near-equal frequencies. We’ll continue to embrace patience, and seek to dig deeper into this current moment’s probabilities next week.
peace_love_crypto-DB

IMPORTANT DISCLAIMER
The information presented and made available in this newsletter is intended for educational purposes only. THE INFORMATION IS NOT AND SHOULD NOT BE CONFUSED WITH INVESTMENT ADVICE AND DOES NOT ATTEMPT OR CLAIM TO BE A COMPLETE DESCRIPTION OF ANY SPECIFIC COINS, TOKENS OR MARKETS OF ANY KIND, BUT RATHER EDUCATIONAL EXAMPLES OF THE APPLICATION OF TECHNICAL ANALYSIS AND QUANTITATIVE ANALYSIS TO THE MARKET. This information has been presented and prepared without regard to any particular person's investment objectives, financial situation and particular needs because as individuals come from diverse backgrounds, with diverse objectives and financial situations. This information is of a general nature only so you should seek advice from your investment advisor or other financial professional as appropriate before taking any action. The opinions and analyses included herein are based on sources and data believed to be reliable and are presented in good faith, however no representation or warranty, expressed or implied is made as to their completeness or accuracy. It is imperative to understand your investment risks since all stock investments involve significant risk. The user of REKTelligence’s newsletters, podcasts, courses, coaching and other educational services agrees to indemnify and hold harmless REKTelligence LLC from and against any and all liabilities, expenses (including attorney's fees), and damages arising out of claims resulting from the use of this educational content. REKTelligence LLC is not a licensed investment advisor.
© 2023 REKTelligence LLC