


Bitcoin's VOLticipation Indicator Climbs Toward Key Level

IN TODAY’S REPORT
What we cover: Bitcoin's VOLticipation ST indicator climbs toward the key 25 level ahead of FOMC announcement. Just five VOLticipation ST extremes for Bitcoin ever. Alt Season it (still) ain’t.
TODAY’S STATS
The REKTelligence VOLticipation ST Indicator May Hit Key Level
Since the SEC-fueled volatility of early last week, Bitcoin has logged some of its narrowest candles in several weeks over the past 7 sessions, today’s partial session included. As a result, we’re seeing a sudden spike in one of our favorite new REKTelligence indicators: the VOLticipation ST, a historical volatility-based formula designed to anticipate escalations of future price volatility. Measuring various differentials in past volatility, the VOLticipation ST indicator is part of a series of VOLticipation indicators all designed to forecast new bursts of price movement on the horizon.
With today’s VOLticipation ST reading hitting an intraday high of 21.4 - a level not seen in several months - Bitcoin may be a few days to a few weeks away from the start of a major price move. With this in mind, we’ll take a look at all past VOLticipation ST readings of 25 or higher for all of Bitcoin’s history to see what this suggests for the king crypto now.
2011 | Bitcoin VOLticipation ST Spike > 25
BITCOIN (BTC/USD). Daily Chart with VOLticipation ST and 200ma. Dec 2011 Spike.

While many analysts draw frequent parallels between today's post bear market environment and 2019 which followed the 2018 crypto winter, this late 2011 signal followed the first major correction for Bitcoin ever and may prove to be a better analog to today's environment than 2019, technically speaking. While the 2011 correction is not shown in this chart, the recovery is. Following the December VOLticipation ST spike to 27.1, 2012 saw a period of sideways consolidation followed by an impressive more than doubling of price in just a handful of months.
2014 | Bitcoin VOLticipation ST Spike > 25
BITCOIN (BTC/USD). Daily Chart with VOLticipation ST and 200ma. April 2014 Spike.

In late 2013, Bitcoin had recently spiked above the 1000 level for the first time. After a few months of a serious correction and drawdown from its new all-time high, the 2014 VOLticipation ST spike to 29.9 occurred during a brief respite in selling pressure, subsequently leading to an impressive bounce before running into the 200-day moving average. The rest of the year, however, saw a steady slow motion slide and continued sell off into 2015. This VOLticipation ST signal stands out for occurring right before a solid upward price move but then subsequently seeing Bitcoin experience another massive leg down.
2015 | Bitcoin VOLticipation ST Spike > 25
BITCOIN (BTC/USD). Daily Chart with VOLticipation ST and 200ma. August 2015 Spike.
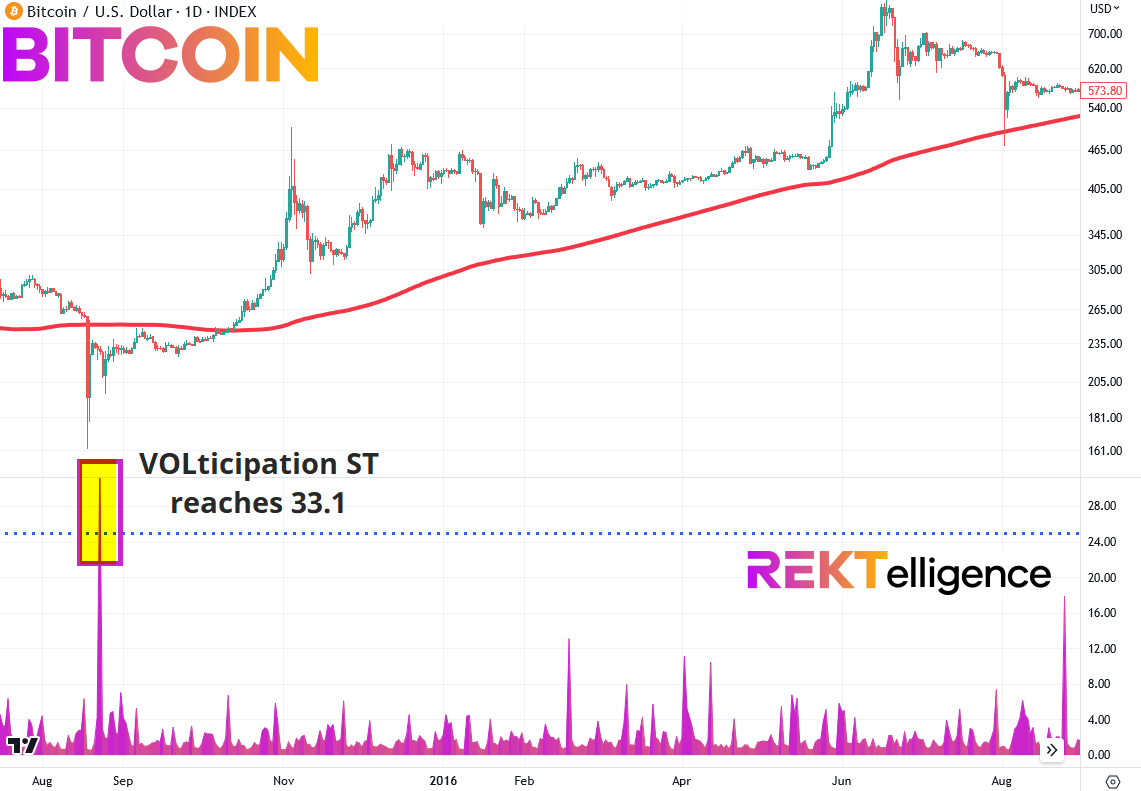
Bitcoin’s 2015 VOLticipation ST signal saw a spike to 33.1 right before a major relief rally, the formation of a multi-month ascending triangle, and an eventual upside breakout during the summer of 2016, bringing price from below 250 all the way up to nearly 800.
2020 | Bitcoin VOLticipation ST Spike > 25
BITCOIN (BTC/USD). Daily Chart with VOLticipation ST and 200ma. June 2020 Spike.

Bitcoin’s extreme VOLticipation ST spike to 57.5 occurred during the early COVID era and just following 2020’s having event. This period of relative price stability and continued sideways movement eventually led to a similar sideways phase in the fall before vaulting to a new all-time high above 60,000 by Spring 2021.
2022 | Bitcoin VOLticipation ST Spike > 25 and Current Intraday Reading
BITCOIN (BTC/USD). Daily Chart with VOLticipation ST and 200ma. Nov 2022 Spike.

The most recent VOLticipation ST spike above the 25 level occurred around the absolute low of the 2022 bear market just following the collapse of the FTX exchange and its FTT token. Roughly a month and a half later, Bitcoin doubled as 2023 got underway. As the current daily bull flag pattern continues to form in this environment of extreme regulatory angst, we’ll be watching closely for another potential VOLticipation ST spike above the key 25 level. An extreme at this juncture could presage the next major Bitcoin move. Based on our limited history of such signals, we’d look for an upward break and advance toward 35,000 and beyond.
THE TECHNICAL VIEW
The Altcoin Tide is Still Receding
TOTAL3 shows the Total Crypto Market Cap excluding Bitcoin and Ethereum, providing us a good view of the altcoin space. As we’ve highlighted before, TOTAL3 has been unable to break above its November 2022 highs, failing to follow Bitcoin and Ether as they traversed the same highs earlier this year. It’s for this exact reason that we’ve previously declared that Alt Season it ain’t. Following the SEC-fueled bloodshed in alts, the REKTelligence STRETCH % indicator shows that TOTAL3 is now approximately -9.0% below the 20MA and a retest of the 2022 lows looks a near certainty. Several past lows in TOTAL3 have seen the STRETCH % reach at least -15.0%, so we could easily see more altcoin weakness ahead. We’ll continue to stick with the megacaps for now (i.e. BTC and ETH), avoiding the treacherous tide currently washing out the sh*tcoins. Stay alert out there… the altcoin tide is still receding, and filled with rip currents.
TOTAL MARKET CAP excluding $BTC & $ETH (TOTAL3). Daily Chart with STRETCH %.

THE TLDR
A Few Key Takeaways
✔ We’re seeing a sudden spike in one of our favorite new REKTelligence indicators: the VOLticipation ST
✔ The late 2011 signal followed the very first major correction for Bitcoin ever and may prove to be a better analog to today's environment than 2019, technically speaking
✔ An extreme at this juncture could presage the next major Bitcoin move
✔ Several past lows in TOTAL3 have seen the STRETCH % reach at least -15.0%, so we could easily see more altcoin weakness ahead.
peace_love_crypto-DB
IMPORTANT DISCLAIMER
The information presented and made available in this newsletter is intended for educational purposes only. THE INFORMATION IS NOT AND SHOULD NOT BE CONFUSED WITH INVESTMENT ADVICE AND DOES NOT ATTEMPT OR CLAIM TO BE A COMPLETE DESCRIPTION OF ANY SPECIFIC COINS, TOKENS OR MARKETS OF ANY KIND, BUT RATHER EDUCATIONAL EXAMPLES OF THE APPLICATION OF TECHNICAL ANALYSIS AND QUANTITATIVE ANALYSIS TO THE MARKET. This information has been presented and prepared without regard to any particular person's investment objectives, financial situation and particular needs because as individuals come from diverse backgrounds, with diverse objectives and financial situations. This information is of a general nature only so you should seek advice from your investment advisor or other financial professional as appropriate before taking any action. The opinions and analyses included herein are based on sources and data believed to be reliable and are presented in good faith, however no representation or warranty, expressed or implied is made as to their completeness or accuracy. It is imperative to understand your investment risks since all stock investments involve significant risk. The user of REKTelligence’s newsletters, podcasts, courses, coaching and other educational services agrees to indemnify and hold harmless REKTelligence LLC from and against any and all liabilities, expenses (including attorney's fees), and damages arising out of claims resulting from the use of this educational content. REKTelligence LLC is not a licensed investment advisor.
© 2023 REKTelligence LLC