


Bitcoin's 10-Day Range Narrows. What's Next?

IN TODAY’S REPORT
What we cover: Bitcoin’s 10-day range falling to below 2.1%. Holding Times Comparison, 2011-Now vs Last Five Years. Normies vs the Faithful.
TODAY’S STATS
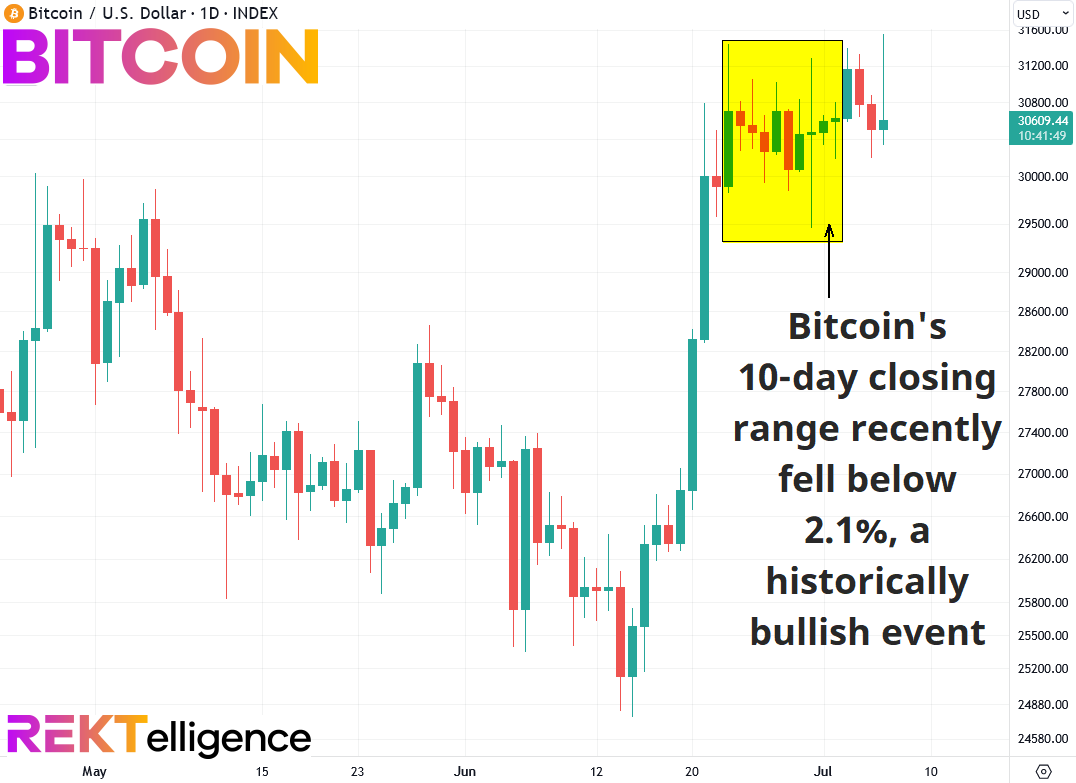
Bitcoin’s Range Drops Below 2.1% As 31,000 Rules
Once again Bitcoin pounds its fists on the 31,000 ceiling. But for all of its intraday effort, the king crypto has only managed a single successful end-of-day close above the key resistance level in 2023 so far. The psychologically important 30,000 level may have been vanquished, but it’s 31,000 that rules the day.
Today we take a look at the recent sharp drop in Bitcoin’s closing range, more specifically what the 10-day range falling to below 2.1% means historically. We’ll examine all data as well as more recent data over the last five years. Let’s dive in!
BITCOIN (BTC/USD). Daily Chart with 10-Day Range <= 2.1%.
QUERY SETUP CONDITIONS:

CONDITION 1: Bitcoin's 10-day closing range <= 2.1%

ENTRY AND EXIT CONDITIONS:

1. ENTRY CONDITION: Enter long ("buy") at the open of the next daily candle
2. EXIT CONDITION: Exit ("sell") N-days later
BITCOIN (BTC/USD). Holding Times Comparison, 2011-Now vs Last Five Years.

The holding time comparison shows what’s happened in the past after prior instances of Bitcoin’s 10-day range falling to below 2.1%. While we rarely expect more recent data to show results on par with results for the entire 2011 to present history of Bitcoin, here we see Average Trade numbers which are remarkably similar for exits ranging from 7 days to (arguably) 60 days.
In short, there appears to be no degradation of the edge in more recent years.
Moving out on the holding time scale to 90 days and beyond, however, we can see a dramatic drop in returns over the last five years. That said, the last five years also show Average Trade results of 40.2%, 128.7%, and 135.7% over the 90, 180, and 365-day periods. Few traders would argue with similar results potentially following from the current setup.
While averages are simply a guide, if the averages for the last five years were to play out perfectly going forward, we’d see Bitcoin at 42,837 by October, 70,041 by January, and 72,185 by July 2024. While the current narrow range will likely lead to future volatility, some of the best setups come when the crypto market crabs boringly sideways for weeks. In such scenarios, normies lose all interest and only the faithful remain awake and at the ready.
Whatever plays out from here, the odds favor upside. But as always, keep your risk controls in place and avoid complacency like the plague.
THE TLDR
A Few Key Takeaways
✔ Average Trade numbers for exits ranging from 7 days to 60 days over the last five years are remarkably similar to results for the same periods 2011 - present
✔ There appears to be no degradation of the short-term edge in more recent years
✔ If the averages for the last five years were to play out perfectly, we’d see Bitcoin at 42,837 by October, 70,041 by January, and 72,185 by July 2024
peace_love_crypto-DB
IMPORTANT DISCLAIMER
The information presented and made available in this newsletter is intended for educational purposes only. THE INFORMATION IS NOT AND SHOULD NOT BE CONFUSED WITH INVESTMENT ADVICE AND DOES NOT ATTEMPT OR CLAIM TO BE A COMPLETE DESCRIPTION OF ANY SPECIFIC COINS, TOKENS OR MARKETS OF ANY KIND, BUT RATHER EDUCATIONAL EXAMPLES OF THE APPLICATION OF TECHNICAL ANALYSIS AND QUANTITATIVE ANALYSIS TO THE MARKET. This information has been presented and prepared without regard to any particular person's investment objectives, financial situation and particular needs because as individuals come from diverse backgrounds, with diverse objectives and financial situations. This information is of a general nature only so you should seek advice from your investment advisor or other financial professional as appropriate before taking any action. The opinions and analyses included herein are based on sources and data believed to be reliable and are presented in good faith, however no representation or warranty, expressed or implied is made as to their completeness or accuracy. It is imperative to understand your investment risks since all stock investments involve significant risk. The user of REKTelligence’s newsletters, podcasts, courses, coaching and other educational services agrees to indemnify and hold harmless REKTelligence LLC from and against any and all liabilities, expenses (including attorney's fees), and damages arising out of claims resulting from the use of this educational content. REKTelligence LLC is not a licensed investment advisor.
© 2023 REKTelligence LLC