Bitcoin: Our Volticipation Index Says Buckle Up
IN TODAY’S REPORT
What we cover: Technical View edition. REKTelligence Volticipation Index LT signal hits. Measuring beneath the surface of price.
TODAY’S TECHNICAL VIEW
Beneath The Surface Of Price
Compared to its normal and infamous price volatility, the oppressive stillness of Bitcoin’s current price action looks utterly static and unchanging.
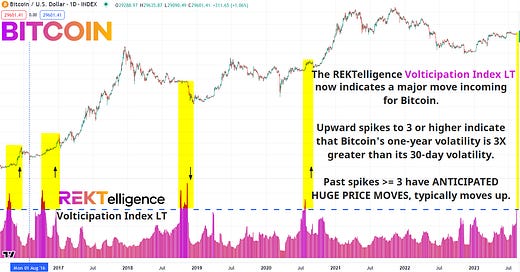
A minute or two spent with our REKTelligence Volticipation Index LT, however, and you see that there’s a lot happening beneath that surface of price. Even as price appears little changed, the recent climb in our long-term Volticipation Index now indicates a major move incoming for Bitcoin.
BITCOIN (BTC/USD). Daily Chart with REKTelligence Volticipation Index LT.
While we’ve been expecting a major price move for some time based on a variety of studies in recent reports, the Volticipation Index enables us to precisely measure the relationship between short-term volatility (30-day vol) and long-term volatility (365-day vol) for clues as to timing.
What’s the logic behind this relationship? When short-term volatility falls dramatically below the historical long-term volatility level, this indicates an unusual contraction in price movement. By designing the indicator to move up even as this key volatility ratio moves down, we can easily spot anomalies like we’re seeing right now.
The point? These contractions lead to rare high levels for the Volticipation Index — extreme high levels which rarely last for long.
Upward spikes to 3.00 or higher — as we’re seeing now — indicate that Bitcoin's one-year volatility is roughly three times greater than its 30-day volatility. In recent years, past spikes to 3.00 or higher have anticipated huge price moves, typically moves up.
With little risk of hyperbole, volatility reversions may just be one of the most reliable types of signals in all of finance. Mark my words: Bitcoin’s short-term volatility will revert eventually, and sooner rather than later. Buckle up — there’s a major Bitcoin price move incoming.
THE TLDR
A Few Key Takeaways
✔ Volticipation Index LT enables us to precisely measure the relationship between short-term volatility (30-day vol) and long-term volatility (365-day vol)
✔ By designing the indicator to move up even as this key volatility ratio moves down, we can easily spot anomalies
✔ Past spikes to 3.00 or higher have anticipated huge price moves, typically moves up
peace_love_crypto-DB
IMPORTANT DISCLAIMER
The information presented and made available in this newsletter is intended for educational purposes only. THE INFORMATION IS NOT AND SHOULD NOT BE CONFUSED WITH INVESTMENT ADVICE AND DOES NOT ATTEMPT OR CLAIM TO BE A COMPLETE DESCRIPTION OF ANY SPECIFIC COINS, TOKENS OR MARKETS OF ANY KIND, BUT RATHER EDUCATIONAL EXAMPLES OF THE APPLICATION OF TECHNICAL ANALYSIS AND QUANTITATIVE ANALYSIS TO THE MARKET. This information has been presented and prepared without regard to any particular person's investment objectives, financial situation and particular needs because as individuals come from diverse backgrounds, with diverse objectives and financial situations. This information is of a general nature only so you should seek advice from your investment advisor or other financial professional as appropriate before taking any action. The opinions and analyses included herein are based on sources and data believed to be reliable and are presented in good faith, however no representation or warranty, expressed or implied is made as to their completeness or accuracy. It is imperative to understand your investment risks since all stock investments involve significant risk. The user of REKTelligence’s newsletters, podcasts, courses, coaching and other educational services agrees to indemnify and hold harmless REKTelligence LLC from and against any and all liabilities, expenses (including attorney's fees), and damages arising out of claims resulting from the use of this educational content. REKTelligence LLC is not a licensed investment advisor.
© 2023 REKTelligence LLC


