


Bitcoin Just Gained >=+170% In 180 Days. Here's What's Happened In Past Cycles
Bitcoin $149,114 by September? Here's the logic.

IN TODAY’S REPORT
What we cover: STATS EDITION. Bitcoin’s current technical setup. $149,114 by September?
TODAY’S STATS
Intoxicating & Overheated
Bitcoin’s post-spot ETF approval behavior has been intoxicating for crypto watchers. Lately, however, a handful of onchain metrics and sentiment indicators like the Crypto Fear & Greed Index have suggested frothy short-term levels desperately in need of a release valve. So no surprise that the past three days have seen Bitcoin and the broader crypto market cool off.
For veteran market watchers, the fact that this is happening just days ahead of the Federal Reserve’s next FOMC meeting should be no shock. FOMC meetings often exert a gravitational influence on risk and non-risk markets alike, pushing or pulling existing trends out of their prior orbit.
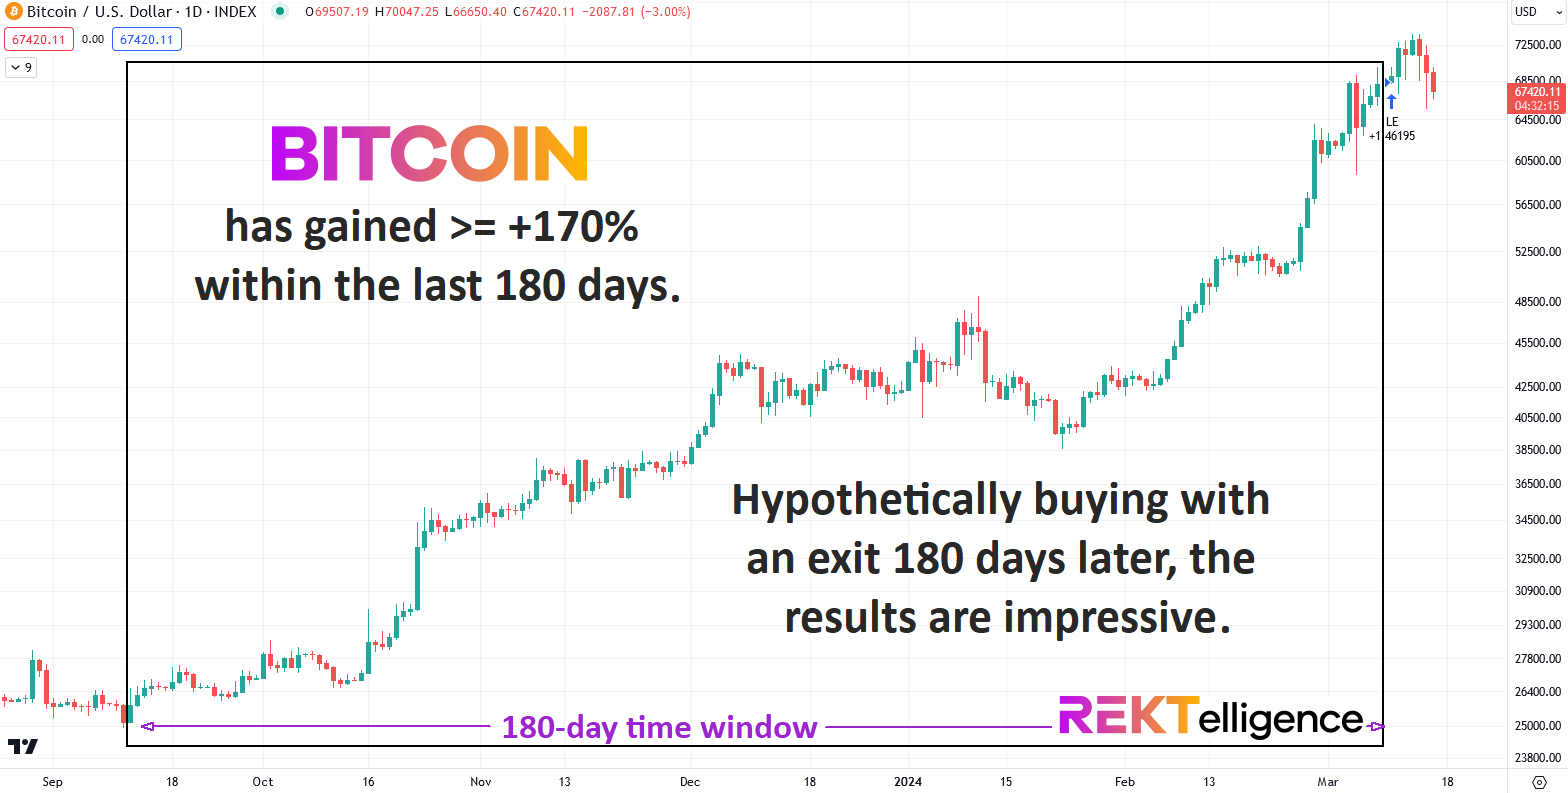
Within the last several sessions, Bitcoin achieved a >= +170% gain within just 180 days — a milestone which has only occurred 10 times prior to the latest signal.
Today we examine what’s happened over the NEXT 180 days anytime this same milestone has occurred since 2011.
BITCOIN (BTC/USD). Daily Chart with 180-day Time Window and BTC >=+170% Gain.
To take a closer look at the future implications of the current setup, we need to run a simple test over all of Bitcoin’s reliable history from 2011 to the present. Our “query conditions” represent a basic definition of the technical state of BTCUSD. The simpler the conditions the more data points we get to consider (three conditions is our typical maximum).
First, our simple query condition with a 180-day hold:
BITCOIN SETUP CONDITIONS

CONDITION 1: Bitcoin gains >= +170% within 180 days


ENTRY AND EXIT CONDITIONS:

1. ENTRY CONDITION: Enter long ("buy") at the open of the next candle
2. EXIT CONDITION: Exit ("sell") 180-days laterSince 2011, Bitcoin has experienced these conditions 10 times — a fairly rare event. That said, the S&P 500 Index has never done this —not even once — using data back to 1950. So from the perspective of TradFi markets, 10 times since 2011 is arguably damn common.
On the chart below, we display all hypothetical trades since inception, shown with a 180-day hold time. The dates below correspond to the hypothetical EXIT DATE of the setup (i.e., 180 days after the setup conditions have been met).
BITCOIN (BTC/USD). Today’s Conditions: All Trades w/ 180-day Hold. 2011-Now.

While the largest gain occurred in 2011 — the truly extraordinary outlier of +4334% — the majority of prior gains for this setup occurred between 2013 and 2017. More recent gains have been more muted.
With only 3 closed losses to date using our conditions, Bitcoin has gained following this setup precisely 70% of the time. While one of these hypothetical losses exceeds -50%, the other losses have been relatively mild in comparison, neither exceeding -20%.
Now let’s throw out the phenomenal outlier from Bitcoin’s early history and get an arguably more realistic look at what we might expect going forward.
BITCOIN (BTC/USD). All Trades w/ 180-day Hold, EXCLUDING OUTLIER. 2011-Now.

Tossing out 2011’s nearly incomprehensible outlier of 4824% (!), the average trade drops precipitously from +599% down to +128%.
A “mere” +128% gain from the recent closing level of $68,401 (March 9th, 2024) — which triggered today’s study — would put Bitcoin at $149,114 by September 5th, 2024.
While financial markets guarantee little except that predictions are impossibly difficult — especially about the future, as Yogi Berra would say — our limited stats suggest a reasonable chance of substantial upside roughly 6 months later.
In light of early spot ETF inflows and the upcoming halving hitting Bitcoin next month, perhaps Bitcoin will generate another outlier for the first time in years.
While we won’t hold our breathe, we will HODL.
Until next time…
peace_love_crypto-DB

IMPORTANT DISCLAIMER
The information presented and made available in this newsletter is intended for educational purposes only. THE INFORMATION IS NOT AND SHOULD NOT BE CONFUSED WITH INVESTMENT ADVICE AND DOES NOT ATTEMPT OR CLAIM TO BE A COMPLETE DESCRIPTION OF ANY SPECIFIC COINS, TOKENS OR MARKETS OF ANY KIND, BUT RATHER EDUCATIONAL EXAMPLES OF THE APPLICATION OF TECHNICAL ANALYSIS AND QUANTITATIVE ANALYSIS TO THE MARKET. This information has been presented and prepared without regard to any particular person's investment objectives, financial situation and particular needs because as individuals come from diverse backgrounds, with diverse objectives and financial situations. This information is of a general nature only so you should seek advice from your investment advisor or other financial professional as appropriate before taking any action. The opinions and analyses included herein are based on sources and data believed to be reliable and are presented in good faith, however no representation or warranty, expressed or implied is made as to their completeness or accuracy. It is imperative to understand your investment risks since all stock investments involve significant risk. The user of REKTelligence’s newsletters, podcasts, courses, coaching and other educational services agrees to indemnify and hold harmless REKTelligence LLC from and against any and all liabilities, expenses (including attorney's fees), and damages arising out of claims resulting from the use of this educational content. REKTelligence LLC is not a licensed investment advisor.
© 2024 REKTelligence LLC