


Bitcoin Bearish Engulfing? Not As Bearish As You Think

TODAY’S STATS
An Examination of Weekly Bearish Engulfing Candles in Bitcoin
Bitcoin has ripped ahead of all other asset classes to start 2023. But no market rises uninterrupted, and aggressive selling pressure hit the crypto market hard last Wednesday, pushing prices lower into the weekend. For those new to markets, this is perfectly healthy market behavior, at least at this point. In fact, beware of markets that vault ceaselessly higher without a pause because they are the FOMO-driven markets running on fumes about to stall at best, or crash at worst. Human nature is one of the few constants, so rest assured we’ll see such markets down the road. When the madness of the crowd is both palpable and measurable, we’ll be there to sell, to lock profits, and to give the wide-eyed, satoshi-hungry mob what they want.
While many on crypto twitter (CT) have labeled Bitcoin’s most recent weekly candle a Bearish Engulfing, our preferred data source says damn close but not quite. That said, we’ll take the opportunity to examine past weekly Bearish Engulfing candles for all of Bitcoin’s history (for which there is quality data, 2011 - now) along with stats for a variation which describes last week’s action even more precisely.
BITCOIN (BTC/USD). Weekly Chart with RSI(3).

Let’s look at stats for the following setup and entry/exit conditions.
OUR INITIAL QUERY'S SETUP CONDITIONS:

1. Bitcoin forms a Bearish Engulfing Candle on its weekly chart

ENTRY AND EXIT CONDITIONS:

2. Enter long ("buy") at the open of the next weekly candle
3. Exit ("sell") 2 weeks later
Here are the results using a 2-week hold:
BITCOIN (BTC/USD). Query Results for BTC with a 2-Week Hold. 2011-Now.
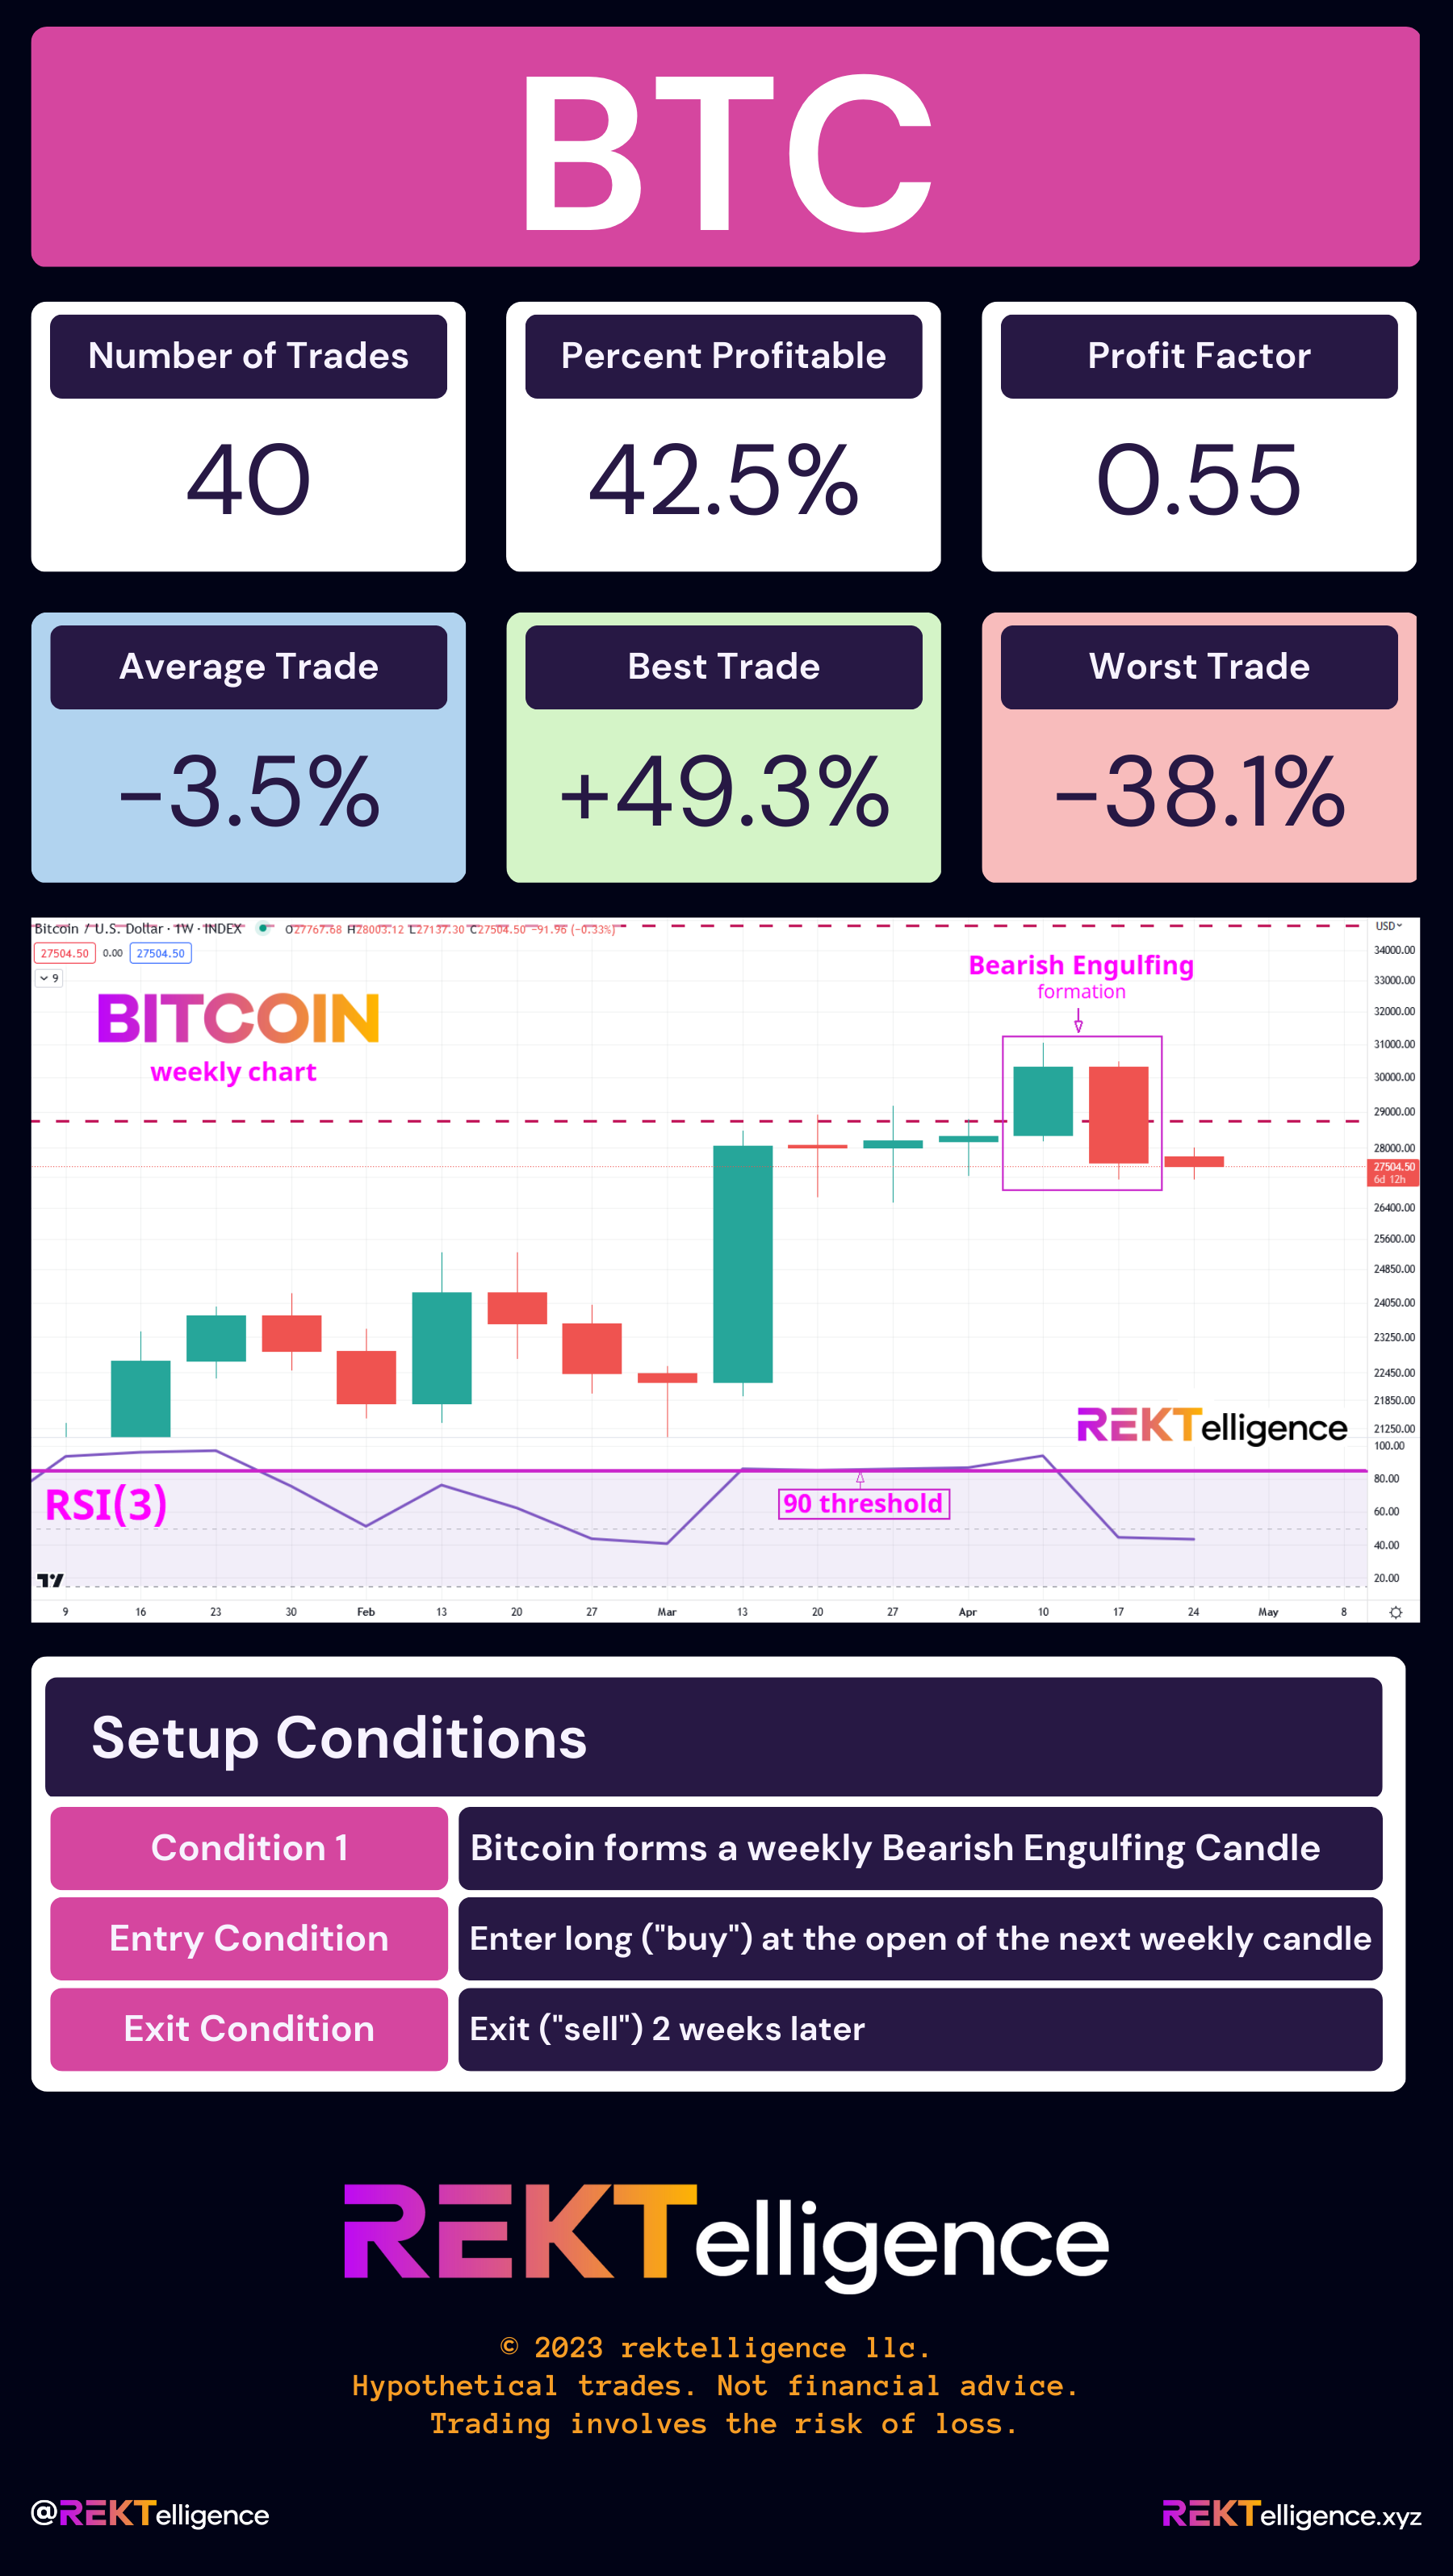
The 40 historical occurrences have been profitable less than half the time, with a poor average trade of -3.5% using a two-week holding time. Clearly the Bearish Engulfing candle lives up to its name over this short-term holding period. Profit Factor scores of 1.00 are breakeven (i.e., the sum of gross gains is equal to the sum of gross losses), so this dismal Profit Factor reading of 0.55 indicates a negative expectation historically. On 40 hypothetical trades, this bearish edge appears highly reliable.
If we expand our holding times, we see that the effects of a weekly Bearish Engulfing candle tend to persist over about a month’s time, with average trade values of -1.4%, -3.5%, and -2.6% for a 1-week, 2-week, and 4-week hold times respectively. Guided by this history, we can expect Bitcoin to see modest downside in the coming weeks.
BITCOIN (BTC/USD). Hold Time Results for Weekly Bearish Engulfing. 2011-Now.

Our weekly chart above shows Bitcoin with a short-term RSI(3), recently at an above average level just one week before last week’s Bearish Engulfing signal. When we test the following conditions, adding in the RSI, the number of instances drops as expected. In other words, we do not see Bearish Engulfing candles form as frequently one week after such an elevated RSI(3) reading. This is rather intuitive, as more conditions typically means fewer results. What’s somewhat counter-intuitive are the results.
OUR REFINED QUERY'S SETUP CONDITIONS:

1. Bitcoin forms a Bearish Engulfing Candle on its weekly chart
2. Bitcoin's weekly RSI(3) >= 90 one week before the bearish engulfing signal

ENTRY AND EXIT CONDITIONS:

2. Enter long ("buy") at the open of the next weekly candle
3. Exit ("sell") 2 weeks later
Here are the new results when the weekly RSI(3) >= 90, using a 2-week hold:
BITCOIN (BTC/USD). Query Results for BTC with a 2-Week Hold. 2011-Now.
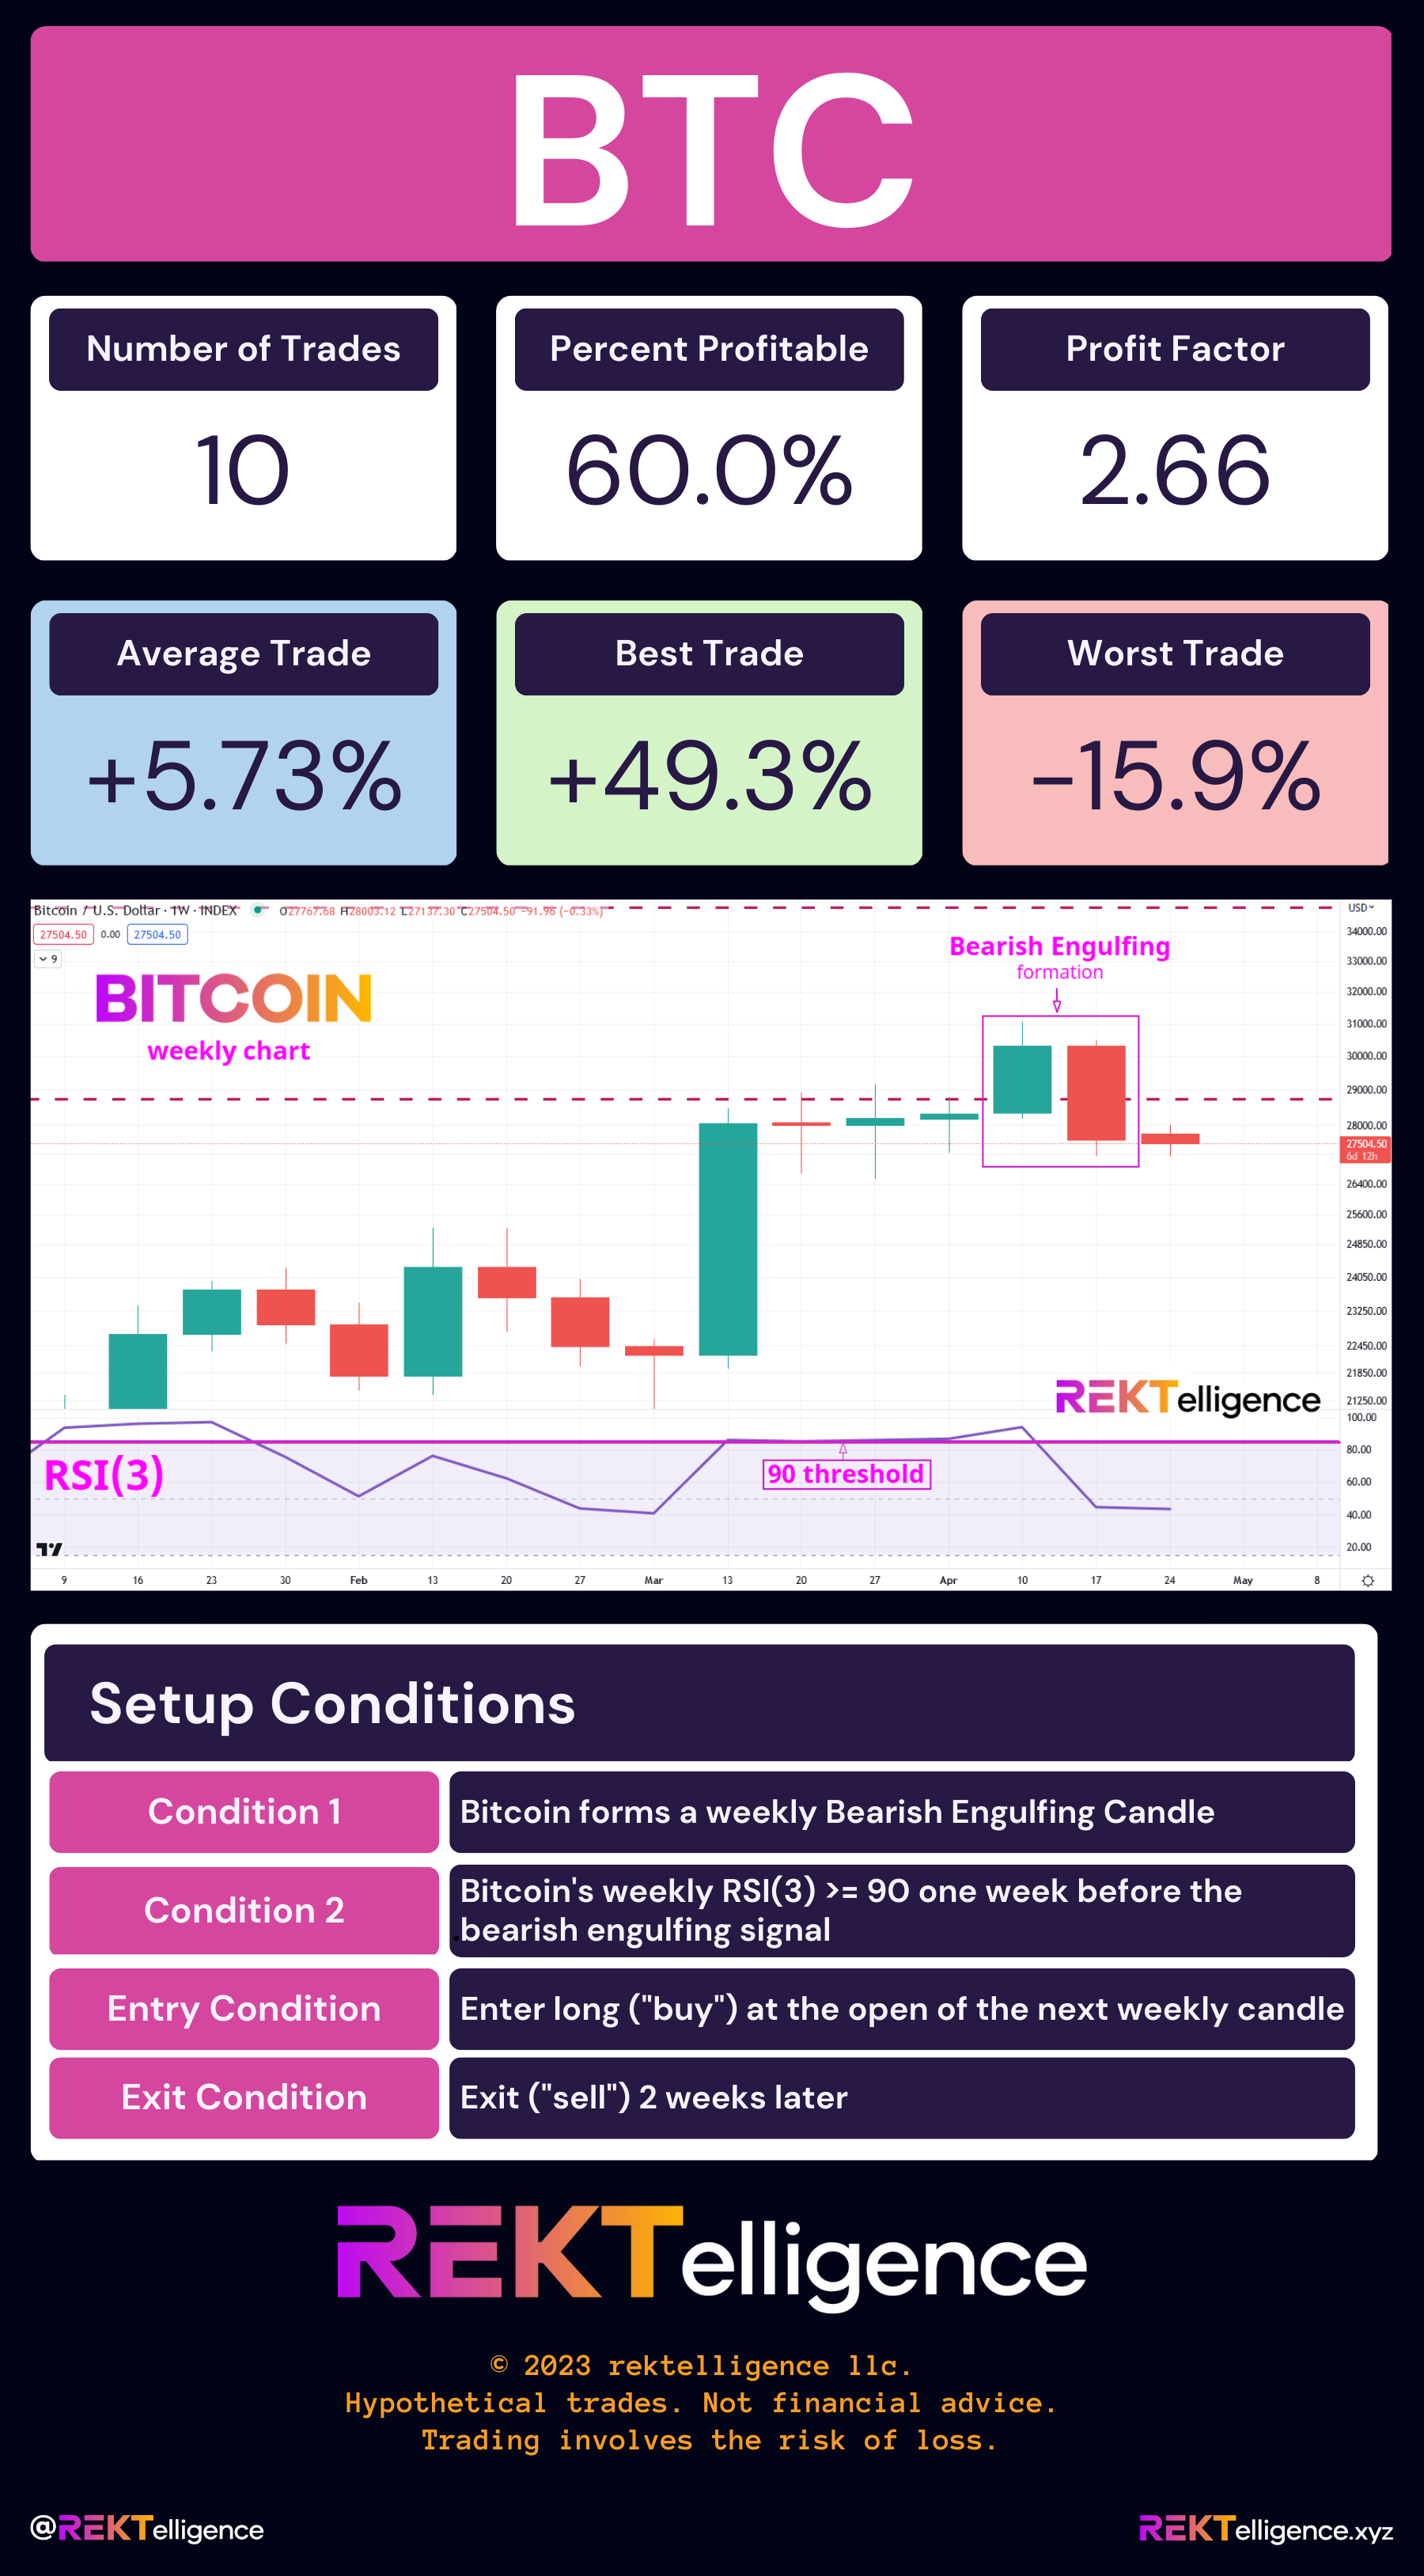
With the same 2-week hold we examined first, the 10 historical occurrences have been profitable 60% of the time with a positive average trade of +5.73% - a major improvement when considering the elevated short-term RSI along with the reversal candle signal. The new Profit Factor score of 2.66 is solidly bullish and in sharp contrast to the earlier bearish score of 0.55.
As we examine additional holding times with the added RSI(3) condition, all holding times are positive, historically speaking. When we include the short-term RSI(3) condition matching recent market conditions, the Bearish Engulfing candle signal turns out not to be as bearish as most traders think. Impressively bullish? No. Worryingly bearish? Not at all. It may not be much to get excited about, but bearish it ain’t.
BITCOIN (BTC/USD). Results for Weekly Bear Engulfing + RSI3[1] >= 90. 2011-Now.

THE TECHNICAL VIEW
Get Your Patience On
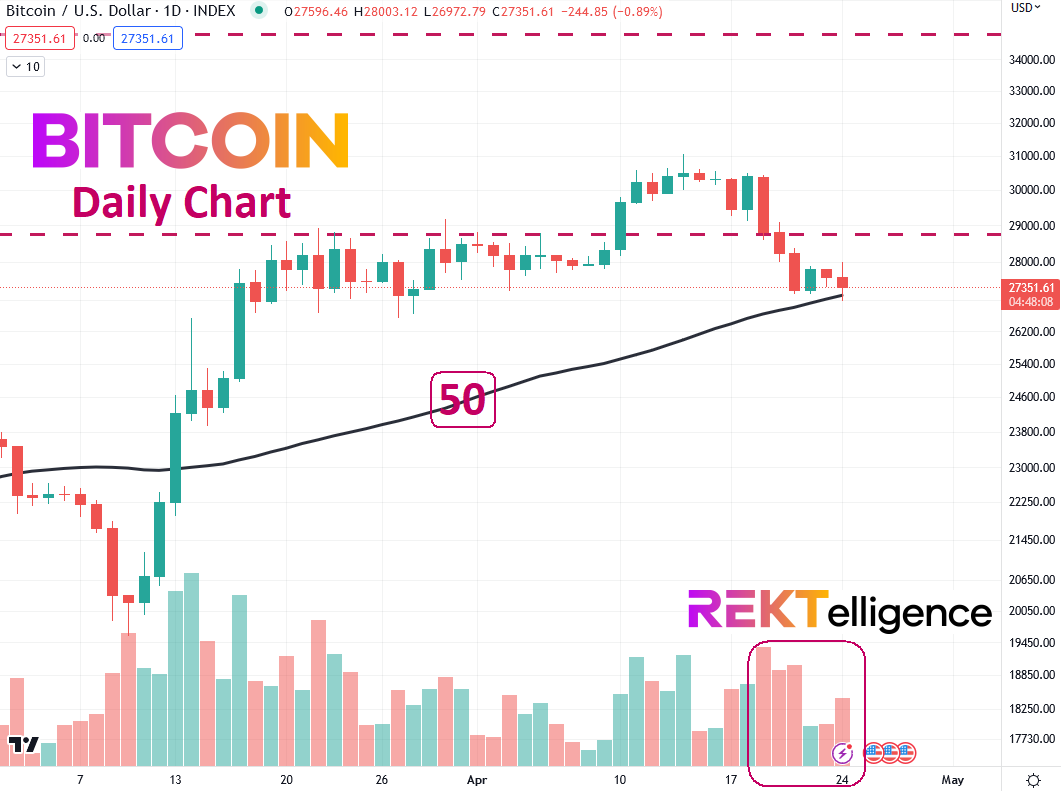
After a strong move to the upside and several weeks spent above rising short and intermediate-term moving averages, the first pullback to the rising 50MA (see chart below) is typically considered buyable by most traders. That said, healthy pullbacks should see declining volume as price moves in an orderly fashion down to support. What the current pullback possesses in terms of orderly structure, however, it lacks in favorable volume characteristics. Elevated volume on the pullback as we see here shows more aggressive sell pressure than we like in this context. The upshot? Much like our two queries above with their arguably contradictory stats, Bitcoin’s daily pattern appears to be a coin flip. We may be in for a choppy ride, especially with Bitcoin having quickly hit the “rough air” we predicted last Monday. All in all, the stats may guide us best here: get your patience on for the near term.
BITCOIN (BTC/USD). Daily Chart with 50MA.
THE TLDR
A Few Key Takeaways
✔ Bitcoin's almost-Bearish Engulfing candle on its weekly chart has CT buzzing
✔ The bearish stats turn bullish when you add in the recent weekly RSI condition
✔ Daily pullback shows poor volume qualities which may negate the buy opportunity
✔ Get your patience on. The rough air we predicted arrived on schedule.
peace_love_crypto-DB
IMPORTANT DISCLAIMER
The information presented and made available in this newsletter is intended for educational purposes only. THE INFORMATION IS NOT AND SHOULD NOT BE CONFUSED WITH INVESTMENT ADVICE AND DOES NOT ATTEMPT OR CLAIM TO BE A COMPLETE DESCRIPTION OF ANY SPECIFIC COINS, TOKENS OR MARKETS OF ANY KIND, BUT RATHER EDUCATIONAL EXAMPLES OF THE APPLICATION OF TECHNICAL ANALYSIS AND QUANTITATIVE ANALYSIS TO THE MARKET. This information has been presented and prepared without regard to any particular person's investment objectives, financial situation and particular needs because as individuals come from diverse backgrounds, with diverse objectives and financial situations. This information is of a general nature only so you should seek advice from your investment advisor or other financial professional as appropriate before taking any action. The opinions and analyses included herein are based on sources and data believed to be reliable and are presented in good faith, however no representation or warranty, expressed or implied is made as to their completeness or accuracy. It is imperative to understand your investment risks since all stock investments involve significant risk. The user of REKTelligence’s newsletters, podcasts, courses, coaching and other educational services agrees to indemnify and hold harmless REKTelligence LLC from and against any and all liabilities, expenses (including attorney's fees), and damages arising out of claims resulting from the use of this educational content. REKTelligence LLC is not a licensed investment advisor.
© 2023 REKTelligence LLC