


Bitcoin 60-Day Lows. A Tale of Two Regimes.

IN TODAY’S LETTER
What we cover: Bitcoin has closed at a 60-day low. Results over 2011-Now vs. the last 5 years. Bitcoin’s 20-Month Moving Average.
TODAY’S STATS
Bitcoin Closes at a 60-day Low and the Results are Mixed
After recently falling into its narrowest range in weeks as the 10-day range of closing prices fell to below 2.5%, Bitcoin has now also closed at a 60-day low. Two-month lows can be made in a variety of ways, and in this case Bitcoin has quietly drifted down with only slight bearish momentum. Let’s run the stats for this setup!
BITCOIN (BTC/USD). Daily Chart with 200ma.

Our first query is simple: how has Bitcoin performed historically when it closes at a 60-day low while above its 200ma? We’ll first look at a simple “sell 90 days later” scenario before looking at various holding times.
OUR BITCOIN QUERY'S SETUP CONDITIONS:

CONDITION 1: Bitcoin closes at a 60-day low
CONDITION 2: Bitcoin closes above its 200ma


ENTRY AND EXIT CONDITIONS:

1. ENTRY CONDITION: Enter long ("buy") at the open of the next daily candle
2. EXIT CONDITION: Exit ("sell") 90 days later
Here are the results using a 90-day hold:
BITCOIN (BTC/USD). Query Results for BTC with a 90-day Hold. 2011-Now.

Using a 90-day hold, the nine historical occurrences have been profitable a less than impressive 44% of the time, signifying that only slightly under half of the signals have been profitable. In sharp contrast, however, is the stunning Profit Factor of 20.94 which indicates that the sum of all hypothetical gains is over 20 times the sum of all hypothetical losses - an impressive metric even for this low number of instances.
Similar to our recent analysis of narrow 10-day ranges, Bitcoin has more than doubled in 3 months on average following 60-day lows which take place above the 200-day moving average. Naturally, the small number of occurrences combined with the massive Best Trade of over 2000% skews the average and we do not anticipate this type of outcome over the next 90 days.
Now let’s look at Bitcoin’s results for Average Gain and Average Loss across various holding times ranging from 7-days to a year using data from 2011- Now. Note that the Win % shows how many trades were profitable, hypothetically speaking.
BITCOIN (BTC/USD). Hold Time Results for Today’s Conditions. 2011-Now.
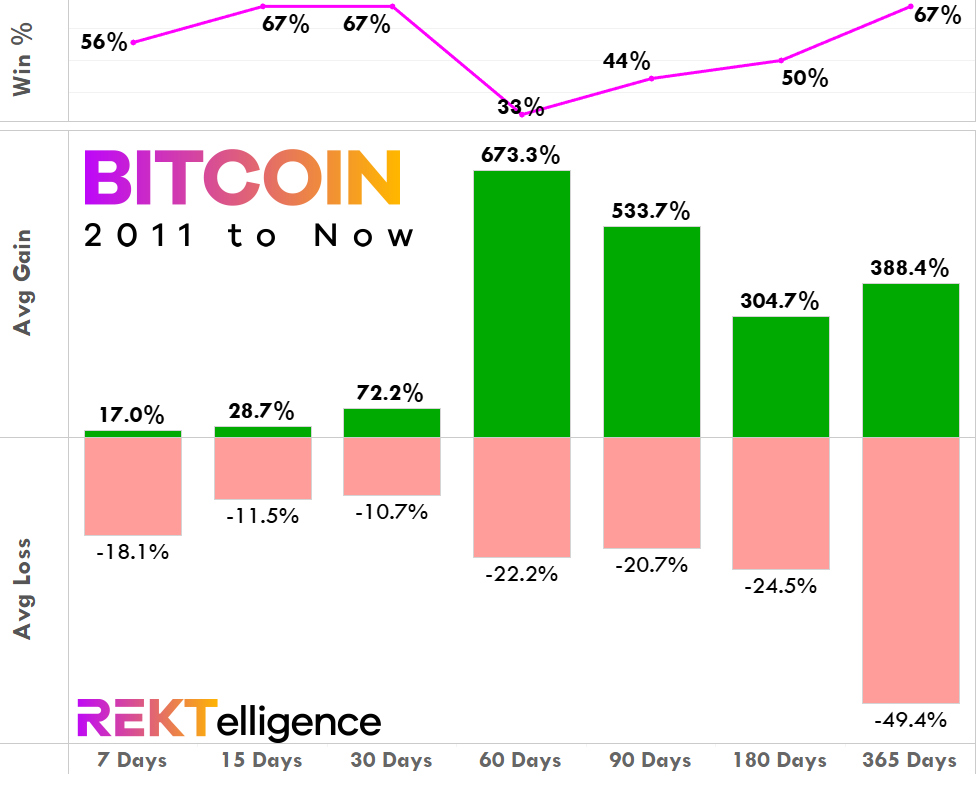
Beyond the first 7 days, the short-term hold times of 15 days and 30 days see average gains easily beating average losses, and with solid winning rates of 67% positive. The 60-day hold has historically seen the lowest winning percentage of just 33%, but delivers the greatest average gain of +673.3 despite that fact. Average losses stay manageable for all hold times with the exception of a 365-day hold which has an unpleasant nearly -50% average loss. All in all, these results are hugely impressive. For an updated look, we’ll take a look at results over the past 5 years which includes two major bear markets (2018 and 2022).
BITCOIN (BTC/USD). Hold Time Results for Today’s Conditions. Last 5 Years.

In stark contrast, results for all holding times from 7 days through 90 days are unequivocally poor, with few wins and average losses ranging from a modest -10.7% to -23%. The one apparently bright spot of a roughly 6-month hold is less impressive when you note the win rate of only 33%. In short, over the past 5 years, buying Bitcoin after it makes a 60-day low has had a negative expectation even when above its 200ma. With the market now in transition from 2022’s treacherous bear environment which saw the fastest rate hikes in U.S history to a 2023’s arguably normalizing monetary conditions, traders may want to take a balanced approach to today’s analysis, taking into account Bitcoin’s full history while noting the more sobering recent data of the last 5 years. Bitcoin's 60-day low suggests dramatically different results across different regimes
THE TECHNICAL VIEW
Bitcoin’s 20-Month Moving Average Remains A Concern
Our most recent Technical View stands (see last week’s comments below), and we can now add the positive edge of the 10-day narrow range to the picture. Bitcoin is set to move soon and potentially attack the Supply Zone overhead. While a downside break remains a possibility we must consider, the odds do not favor it. That said, the best bull periods for Bitcoin have always taken place above the 20-month moving average, and we still remain below that key average. Traders and investors should consider watching this key moving average closely. A monthly close above it would be cause for celebration, while continued slog below it remains a concern.
While there’s no change to our intermediate-term outlook that the 28,750 to 34,800 Supply Zone continues to pose an obstacle to further upside attempts, the short-term picture may now be improving with the potential formation of a classic Bull Flag pattern on Bitcoin’s daily chart. Further consolidation inside of the upper and lower boundary may eventually lead to an upside breakout attempt and a close back above the psychologically important 30,000 level. If this scenario plays out, we’d see yet another attempt to move through the Supply Zone, arguably equivalent to another swing of a wrecking ball. With enough swings at the 28,750 to 34,800 Supply Zone, Bitcoin may just bust through. Beyond the chart, the “Halving vs. Recession” debate remains the central narrative tension dominating Bitcoin at present. The good news? As the current wall of worry for crypto grows, the Bitcoin bulls may be getting ready to scale it. [REKTelligence Report, 5/17/23]
BITCOIN (BTC/USD). Monthly Chart with 20MA.

THE TLDR
A Few Key Takeaways
✔ Bitcoin's 60-day low suggests dramatically different results in different regimes
✔ Historically, Bitcoin has doubled in 3 months on average after this setup
✔ There’s no change to our intermediate-term outlook that the 28,750 to 34,800 Supply Zone continues to pose an obstacle
✔ We still remain below the 20-month moving average - a concern
peace_love_crypto-DB
IMPORTANT DISCLAIMER
The information presented and made available in this newsletter is intended for educational purposes only. THE INFORMATION IS NOT AND SHOULD NOT BE CONFUSED WITH INVESTMENT ADVICE AND DOES NOT ATTEMPT OR CLAIM TO BE A COMPLETE DESCRIPTION OF ANY SPECIFIC COINS, TOKENS OR MARKETS OF ANY KIND, BUT RATHER EDUCATIONAL EXAMPLES OF THE APPLICATION OF TECHNICAL ANALYSIS AND QUANTITATIVE ANALYSIS TO THE MARKET. This information has been presented and prepared without regard to any particular person's investment objectives, financial situation and particular needs because as individuals come from diverse backgrounds, with diverse objectives and financial situations. This information is of a general nature only so you should seek advice from your investment advisor or other financial professional as appropriate before taking any action. The opinions and analyses included herein are based on sources and data believed to be reliable and are presented in good faith, however no representation or warranty, expressed or implied is made as to their completeness or accuracy. It is imperative to understand your investment risks since all stock investments involve significant risk. The user of REKTelligence’s newsletters, podcasts, courses, coaching and other educational services agrees to indemnify and hold harmless REKTelligence LLC from and against any and all liabilities, expenses (including attorney's fees), and damages arising out of claims resulting from the use of this educational content. REKTelligence LLC is not a licensed investment advisor.
© 2023 REKTelligence LLC