


Bitcoin 5-day Low on Worsening Liquidity

IN TODAY’S LETTER
What we cover: Our recent view that the 28,750 - 34,800 area will see “rough air” continues to be correct. The REKTelligence USA Liquidity Index worryingly diverges, and the First Republic rescue may not add much new liquidity to spur risk assets. Today’s Stats for Bitcoin’s likely close at a 5-day low with a 30-day hold. Expanded holding time stats for BTC 5-day low closes above the rising 50ma. FOMC ahead as BTC hits key level.
TODAY’S STATS
Bitcoin Poised to Close at a 5-Day Low
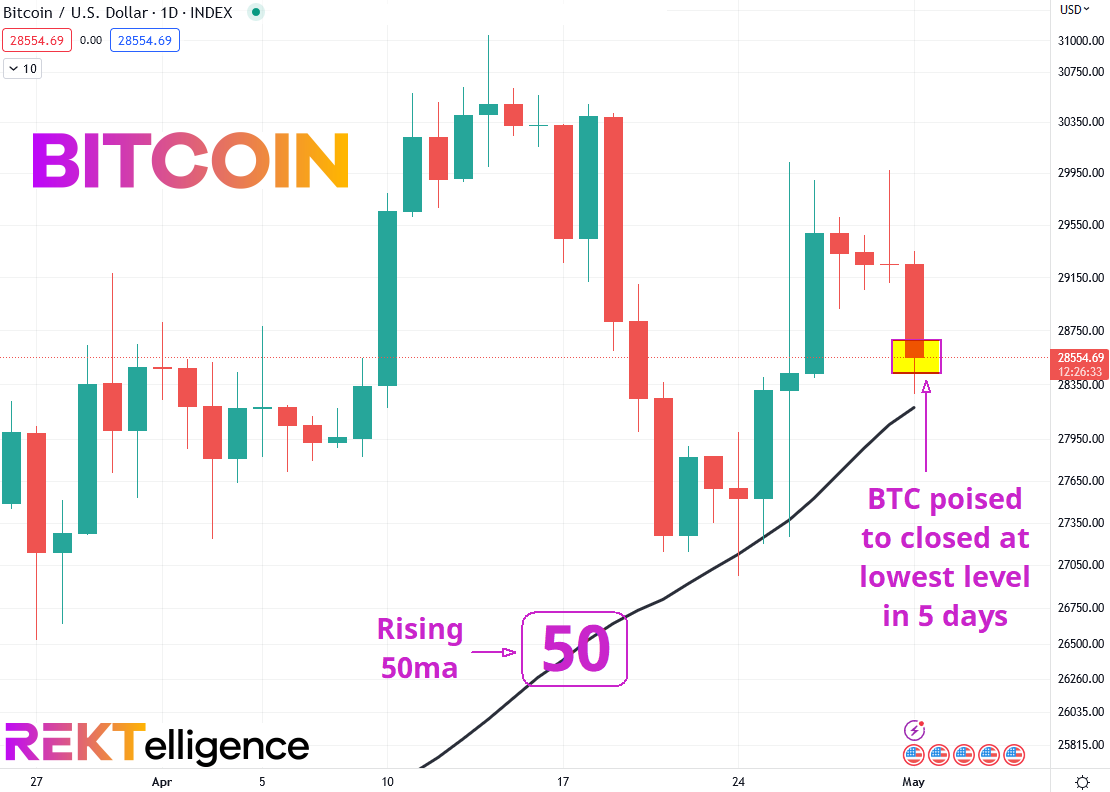
While there’s certainly time for Bitcoin to avoid closing at a 5-day low, the overnight breakdown from its tight 3-day range suggests that a close at a 5-day low is more likely than not to occur by the completion of today’s candle. With that in mind, we take a look at all of Bitcoin’s closes at 5-day lows from 2011 to now, with the addition of a couple conditions which add important context to the current technical setup. First, Bitcoin looks poised to close at a 5-day low but above its 50-day moving average (50ma). Second, the 50ma is currently rising.
BITCOIN (BTC/USD). Daily Chart with rising 50ma.
So today’s query is fairly simple: What’s happened in the past when Bitcoin closes at its lowest level in 5 days and also closes above its rising 50ma? We’ll first look at a simple “sell 30 days later” scenario before looking at various holding times.
OUR BITCOIN QUERY'S SETUP CONDITIONS:

CONDITION 1: Bitcoin closes at the lowest level in 5 days
CONDITION 2: Bitcoin closes above its 50-day moving average (50ma)
CONDITION 3: Bitcoin's 50-day moving average (50ma) is rising


ENTRY AND EXIT CONDITIONS:

1. ENTRY CONDITION: Enter long ("buy") at the open of the next daily candle
2. EXIT CONDITION: Exit ("sell") 30 days later
Here are the results using a 30-day hold:
BITCOIN (BTC/USD). Query Results for BTC with a 30-day Hold. 2011-Now.

The 79 historical occurrences have been profitable nearly 60% of the time (59.5% win rate) with an average trade of +14.2% over a 30-day holding period. Considering the ample number of historical occurrences (79), the Profit Factor of 3.62 is highly impressive, indicating that the sum of gross hypothetical gains is over 3.6 times the sum of its gross losses. In short, with a 30-day hold, this appears to be a strongly positive short-term edge.
Now let’s look at Bitcoin’s results for Average Gain and Average Loss across various holding times ranging from 7-days to a year. Note that the Win % shows how many trades were profitable, hypothetically speaking.
BITCOIN (BTC/USD). Holding Time Results for Today’s Conditions 2011-Now.

Over the short-term 7-day hold period, the odds of success are negligible, with a Win Rate of only 51% - basically a coin flip. Additionally, the average win barely outpaces the average loss over this one week period resulting in the weakest of upside edges. To be blunt, almost no edge appears to exist over the next week, at least based on this setup. Beyond the 7-day hold, things improve meaningfully with the 15-day and 30-day hold times both having Win Rates at or near 60% profitable. Looking at 90-day hold times and beyond, average gains begin to dwarf average losses with Win Rates ranging from 54% to nearly 70%.
THE TECHNICAL VIEW
Liquidity Drop Looks Worrisome in the Short-term
Our recent view that the 28,750 - 34,800 area will see “rough air” with “turbulence ahead” continues to be correct. Bitcoin has now pushed into this supply zone two times, and twice been rejected.
As predicted, we hit rough air. More turbulence likely ahead. The 28,750 to 34,800 area remains the intermediate-term concern. With significant prior price history (mostly swing lows from the past bull market) sitting just overhead, Bitcoin will likely remain stuck in this area for the foreseeable future, especially with the next halving so many months away and recession fears looming just beyond the horizon. The “Halving vs. Recession” debate is the central tension dominating Bitcoin at present. Throw in a healthy pinch of regulation speculation and you’ve got Ether’s central dilemma. The good news? The current wall of worry for crypto grows, and this may be just what the bulls need to climb over in the long-term.
This latest rejection occurs as Bitcoin approaches its rising 50MA right ahead of Wednesday’s FOMC meeting at which the Fed will announce its latest interest rate decision. With volatility on the decline going into the meeting, we expect volatility to rise following the decision. As noted above, stats for the next 7 days are essentially neutral with no compelling edge. To add to the muddled short-term picture, the REKTelligence USA Liquidity Index worryingly broke down over the past week.
BITCOIN (BTC/USD). Daily Chart with REKTelligence USA Liquidity Index.

Much of the climb in risk assets prior to the bear market was driven by rising USD liquidity and falling rates. Likewise, last year’s dreadful bear market was accompanied by falling USD liquidity and rising rates. The U.S. banking woes last quarter saw liquidity increase and Bitcoin soar, but liquidity since early March has been retreating. We’d prefer otherwise, but we are in a liquidity purgatory for the time being, and despite the rescue of First Republic #FRC over the weekend, only modest liquidity appears to have been added as a result. While we believe that the Fed will eventually pivot by lowering rates and injecting new liquidity into the system due to recession concerns and/or further bank depositor rescues, the outlook for the next few weeks continues to look choppy. We’ll remained buckled for the immediate future and simply raise our glasses to 30 days and beyond, where skies look brighter.
THE TLDR
A Few Key Takeaways
✔ With a 7-day hold, the odds of success are negligible with Win Rate of only 51%
✔ With a 30-day hold, BTC appears to have a strongly positive edge
✔ Looking at 90-day hold times and beyond, average gains dwarf average losses
✔ We are in a liquidity purgatory for the time being
peace_love_crypto-DB
IMPORTANT DISCLAIMER
The information presented and made available in this newsletter is intended for educational purposes only. THE INFORMATION IS NOT AND SHOULD NOT BE CONFUSED WITH INVESTMENT ADVICE AND DOES NOT ATTEMPT OR CLAIM TO BE A COMPLETE DESCRIPTION OF ANY SPECIFIC COINS, TOKENS OR MARKETS OF ANY KIND, BUT RATHER EDUCATIONAL EXAMPLES OF THE APPLICATION OF TECHNICAL ANALYSIS AND QUANTITATIVE ANALYSIS TO THE MARKET. This information has been presented and prepared without regard to any particular person's investment objectives, financial situation and particular needs because as individuals come from diverse backgrounds, with diverse objectives and financial situations. This information is of a general nature only so you should seek advice from your investment advisor or other financial professional as appropriate before taking any action. The opinions and analyses included herein are based on sources and data believed to be reliable and are presented in good faith, however no representation or warranty, expressed or implied is made as to their completeness or accuracy. It is imperative to understand your investment risks since all stock investments involve significant risk. The user of REKTelligence’s newsletters, podcasts, courses, coaching and other educational services agrees to indemnify and hold harmless REKTelligence LLC from and against any and all liabilities, expenses (including attorney's fees), and damages arising out of claims resulting from the use of this educational content. REKTelligence LLC is not a licensed investment advisor.
© 2023 REKTelligence LLC