


Bitcoin 4 Weeks Up? Here Are The Stats
Examining Bitcoin's Current Technical Setup

IN TODAY’S REPORT
What we cover: STATS EDITION. Bitcoin’s current technical setup. Barely an outlier. Current range tortures the impatient. Stats point north.
A Simple Condition
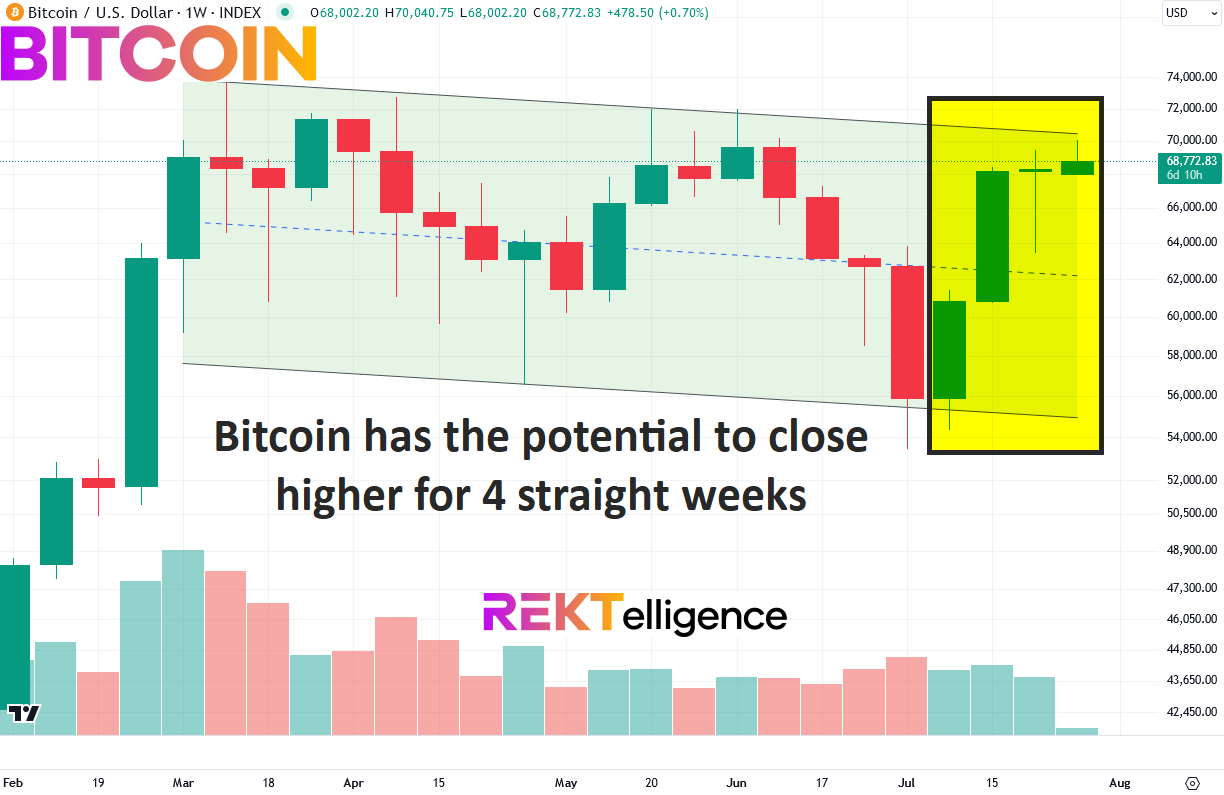
As a new week of trading begins, Bitcoin approaches the $70k handle amid a historic shakeup in the U.S. political election, newly trading spot Ether ETFs, and political campaigns increasingly viewing crypto as an election issue.
On the heels of Bitcoin’s impressive rally off its July lows and the preceding list of developments, today’s report examines a very simple condition: using an 8-week hold time, what’s happened next when Bitcoin has closed up for 4 straight weeks?
While Bitcoin would need to close higher by the end of the week to trigger this simple entry condition, let’s take a look at the implications of this potential setup.
Let’s get to the stats!
BITCOIN (BTC/USD). Weekly Chart with Today’s Query Conditions
To take a closer look at the future implications of the current setup, we need to run a simple test over all of Bitcoin’s reliable history from 2011 to the present. Our “query conditions” represent a basic definition of the technical state of BTCUSD. The simpler the conditions the more data points we get to consider (three conditions is our typical max, though occasioally we include more when required).
First, our simple query conditions with an 8-week hold:
BITCOIN SETUP CONDITIONS

CONDITION 1: Bitcoin closes higher for 4 straight weeks


ENTRY AND EXIT CONDITIONS:

1. ENTRY CONDITION: Enter long ("buy") at the open of the next candle
2. EXIT CONDITION: Exit ("sell") 8 weeks laterSince 2011, Bitcoin has experienced these conditions 28 times — roughly twice per year on average. On the chart below, we display all hypothetical trades since 2011, shown with an 8-week hold time. The dates below correspond to the hypothetical EXIT DATE or QUARTER of the setup (i.e., 8 weeks after the setup conditions have been met).
BITCOIN (BTC/USD). Today’s Conditions: All Trades w/ 8-week Hold. 2011-Now.

The largest gain under current conditions occurred in 2013 — the not-so-much-of-an-outlier outlier of +340.52% — while the largest loss of -32.36% occurred during the thirs quarer of the 2018 bear market.
While the largest gains under these conditions clearly took place in the earlier bull cycle of 2012-2013, we’ve also seen highly respectable, standout gains in the 2017 bull cycle (+134.81%) and 2021 bull cycle (+194.82).
With only 6 closed losses to date using our conditions, Bitcoin has gained following this setup precisely 78.57% of the time using an 8-week exit.
Now let’s throw out the 2013 outlier from Bitcoin’s relatively early history and get an arguably more realistic look at what we might expect going forward.
BITCOIN (BTC/USD). All Trades w/ 8-week Hold. EXCLUDING OUTLIER. 2011-Now.

Tossing out 2013’s not overly outsized trade of +340.52%, the average trade drops down to +59.5% using the same 8-week hold time. This new outlier-excluded average trade is not dramatically lower than the +70.0% which included it. In short, while we’ve seen the magnitude of the average trade drop over the years, average return has not been driven by a single outlier result.
That said, looking at the no-outlier average return, a 59.5% gain from Bitcoin’s current level of $68,121 (intraday July 29th, 2024) would put Bitcoin at $108,652 by late-September 2024.
Using the historical worst loss of -32.46% as a potential worst case downside scenario from current levels, we could also see Bitcoin slide to 46,008 by late September. While this would appear to be an unlikely scenario given the current trend, recently improving global liquidity and other factors, all traders naturally need to consider the potential downside.
Bottom line, as the current months-long Bitcoin range continues to torture the impatient, the stats keep pointing north for Bitcoin.
Until next time…
peace_love_crypto-DB

IMPORTANT DISCLAIMER
The information presented and made available in this newsletter is intended for educational purposes only. THE INFORMATION IS NOT AND SHOULD NOT BE CONFUSED WITH INVESTMENT ADVICE AND DOES NOT ATTEMPT OR CLAIM TO BE A COMPLETE DESCRIPTION OF ANY SPECIFIC COINS, TOKENS OR MARKETS OF ANY KIND, BUT RATHER EDUCATIONAL EXAMPLES OF THE APPLICATION OF TECHNICAL ANALYSIS AND QUANTITATIVE ANALYSIS TO THE MARKET. This information has been presented and prepared without regard to any particular person's investment objectives, financial situation and particular needs because as individuals come from diverse backgrounds, with diverse objectives and financial situations. This information is of a general nature only so you should seek advice from your investment advisor or other financial professional as appropriate before taking any action. The opinions and analyses included herein are based on sources and data believed to be reliable and are presented in good faith, however no representation or warranty, expressed or implied is made as to their completeness or accuracy. It is imperative to understand your investment risks since all stock investments involve significant risk. The user of REKTelligence’s newsletters, podcasts, courses, coaching and other educational services agrees to indemnify and hold harmless REKTelligence LLC from and against any and all liabilities, expenses (including attorney's fees), and damages arising out of claims resulting from the use of this educational content. REKTelligence LLC is not a licensed investment advisor.
© 2024 REKTelligence LLC