


Bitcoin: 2023 Is The New 2015

IN TODAY’S REPORT
What we cover: Bitcoin’s monthly ADX, Rangeometer collapse, HODLer conviction.
THE TECHNICAL VIEW
The Many Parallels
A brutal bear market just last year. Bitcoin off its lows but still in deep drawdown. Multiple volatility measures hitting extreme lows as Bitcoin crabs sideways. Long-term investors refusing to move their coins, HODLing strong just months ahead of the next halving event.
Sound familiar? Clearly yes — it describes mid-2023 perfectly.
But the above paragraph is not about now, but rather late 2015 when Bitcoin’s price was still below $500.
Today’s report examines the many familiar parallels between 2015 and 2023, as well as some distinct differences. Most importantly, what it suggests for Bitcoin’s price going forward.
So So Low ADX
First, we’ll start by looking one of our favorite non-proprietary indicators: the Average Directional Index, or ADX for short. The ADX measures the strength of a trend, rising as the trend strengthens and falling as it wanes and loses momentum. Notably, ADX will act as such irrespective of the direction of the trend. In other words, if an uptrend strengthens, ADX rises. Likewise, if a downtrend strengthens, ADX rises.
It’s when ADX falls to an extreme low level, however — typically below 20 — that we can infer a trendless market condition.
Using the same ADX(10) setting we’ve studied for years on a monthly chart of the king crypto, Bitcoin’s current monthly ADX reading of 18.96 just hit a record low level, indicating a trendless market state.
While this current market condition sounds ominously boring, it’s often a precondition for a massive awakening of volatility. Emphasis on massive.
In the trendless October 2015 market — with its monthly ADX reading at 19.58 — Bitcoin would soon explode from a monthly closing value of $316 to a high of $19,804 just over two years later, with arguably no significant drawdowns along the way. Bitcoin’s 62x blastoff to its late 2017 high began with little excitement and an utterly trendless market state following a brutal 2014 bear market.
In 2015, this low ADX condition preceded the halving by roughly nine months. As we publish today’s report, the next halving is estimated to be roughly nine months away.
BITCOIN (BTC/USD). Monthly Chart with ADX(10)

Rangeometer Collapses
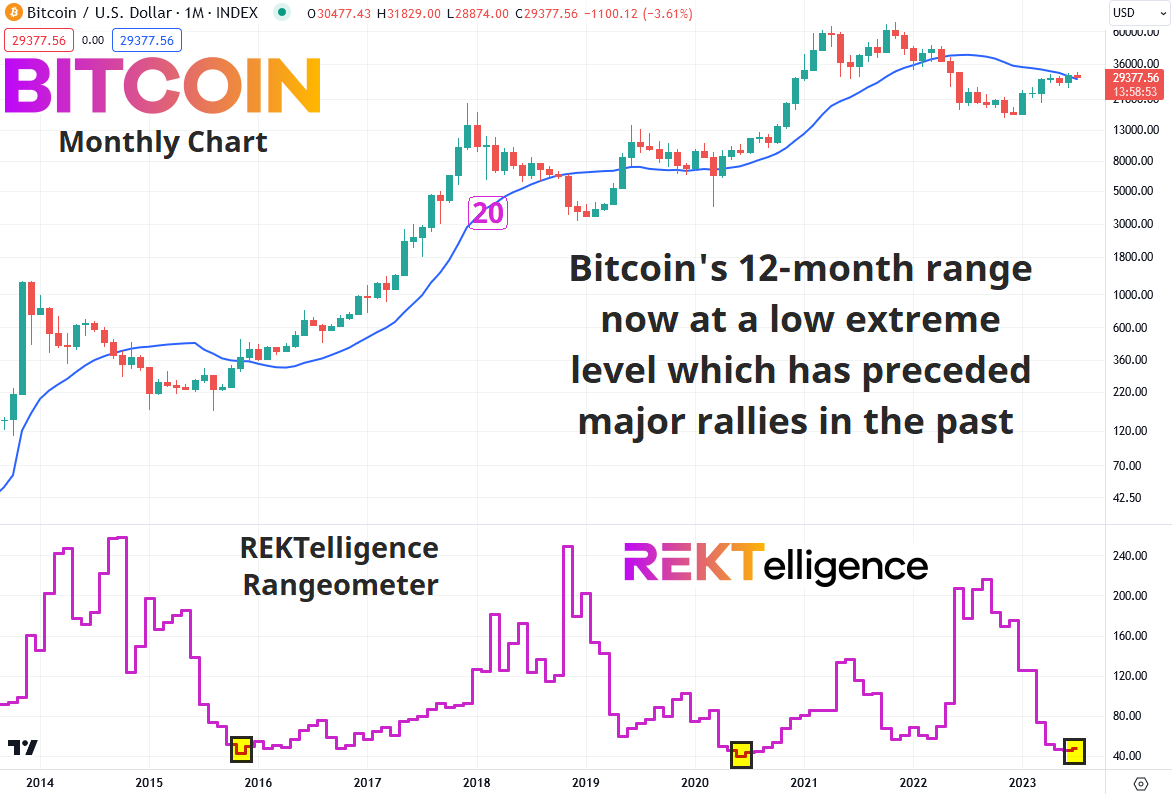
For only the third time, our REKTelligence Rangeometer shows Bitcoin’s 12-month range at an extreme low. In each prior case — 2015 and 2020 — a massive rally followed. Coincidentally, Bitcoin’s price was interacting with its 20-month moving average at these times as well. Just like in 2015 and 2020, Bitcoin currently battles the area of its 20-month moving average.
BITCOIN (BTC/USD). Monthly Chart with REKTelligence Rangeometer.
Fierce HODLer Conviction
Fiat money bleeds value. Put your money under your mattress, and soon your mattress will be worth more than your money. It’s simply a matter of time. In short, fiat money provides no store of value whatsoever. More accurately, fiat is a vehicle of devaluation. Those in our society who find refuge in hard assets can escape this devaluation and even prosper, at least in relative terms to the underlying currency being devalued. The faster you can transform your fiat into something which can actually store value the better. In a fiat society, impatience is a virtue.
In total contrast, Bitcoin’s cryptographically-enforced supply of 21,000,000 cannot be devalued by any single entity or governing body. Against the backdrop of a fiat world, Bitcoin arguably provides the greatest store of value ever created. (Now deflationary since last year’s Merge, a similar argument can be made for Ether, but this is beyond the scope of today’s report.)
This knowledge increasingly spreads across the global network of humanity, infecting investors with a fierce conviction to hold, store, and save. Why part with something designed to resist all the forces of largesse and devaluation? Owning part of the perfect store of value brings the desire to hold on for dear life.
Much like in 2015, the percentage of circulating supply that has not moved in at least a year recently hit a new all-time high. HODLers continue to HODL strong, another precondition for potential explosive upside.
BITCOIN (BTC/USD). Monthly Chart with Percentage of Circulating Supply Metric.

Some Imperfect Parallels
While the technical parallels to 2015 are impressive, the fundamental picture presents some distinct differences, among them the current interest rate environment, rising liquidity in 2015 versus falling liquidity in 2023, and 2015’s total crypto market cap of under $5 Billion markedly different than today’s $1.1 Trillion.
Despite this, it’s our conviction that 2023 may just be the new 2015: a trendless market just waiting to ignite.
THE TLDR
A Few Key Takeaways
✔ Bitcoin’s current monthly ADX reading of 18.96 just hit a record low level, indicating a trendless market state
✔ Bitcoin’s 62x blastoff to its late 2017 high began with little excitement and an utterly trendless market state following a brutal 2014 bear market
✔ Much like in 2015, the percentage of circulating supply that has not moved in at least a year recently hit a new all-time high. HODLers continue to HODL strong, another precondition for potential explosive upside
peace_love_crypto-DB

IMPORTANT DISCLAIMER
The information presented and made available in this newsletter is intended for educational purposes only. THE INFORMATION IS NOT AND SHOULD NOT BE CONFUSED WITH INVESTMENT ADVICE AND DOES NOT ATTEMPT OR CLAIM TO BE A COMPLETE DESCRIPTION OF ANY SPECIFIC COINS, TOKENS OR MARKETS OF ANY KIND, BUT RATHER EDUCATIONAL EXAMPLES OF THE APPLICATION OF TECHNICAL ANALYSIS AND QUANTITATIVE ANALYSIS TO THE MARKET. This information has been presented and prepared without regard to any particular person's investment objectives, financial situation and particular needs because as individuals come from diverse backgrounds, with diverse objectives and financial situations. This information is of a general nature only so you should seek advice from your investment advisor or other financial professional as appropriate before taking any action. The opinions and analyses included herein are based on sources and data believed to be reliable and are presented in good faith, however no representation or warranty, expressed or implied is made as to their completeness or accuracy. It is imperative to understand your investment risks since all stock investments involve significant risk. The user of REKTelligence’s newsletters, podcasts, courses, coaching and other educational services agrees to indemnify and hold harmless REKTelligence LLC from and against any and all liabilities, expenses (including attorney's fees), and damages arising out of claims resulting from the use of this educational content. REKTelligence LLC is not a licensed investment advisor.
© 2023 REKTelligence LLC