


A Quant Says What's Next For Bitcoin

IN TODAY’S REPORT
What we cover: Bitcoin’s selloff examined quantitatively. Going-forward stats on similar past setups.
TODAY’S STATS
Stats And Context Behind Last Week’s Selloff
The long-awaited return of volatility — something we unequivocally expected to arrive very soon — came with a disappointing thud as Bitcoin crapped the bed on Thursday.
Such moments of sudden sharp downside bring out the emotions for many crypto traders and HODLers alike. Along with the heightened expressions of fear and greed around Bitcoin’s behavior come the extreme predictions of doom and glory respectively. Crypto Twitter (Crypto X?) is bursting at the seems with these predictions.
As always, this is where a cool-headed, analytical approach becomes invaluable. Today we’ll look at what’s happened over the entire history of Bitcoin — its reliable history from 2011 on, that is — when last week’s specific conditions occurred in the past. Time to freak out? The darkness before the dawn? Quantification, stats and context guide us at times like these.
BITCOIN (BTC/USD). Daily Chart with REKTelligence Stretch % and Bollinger Bands.
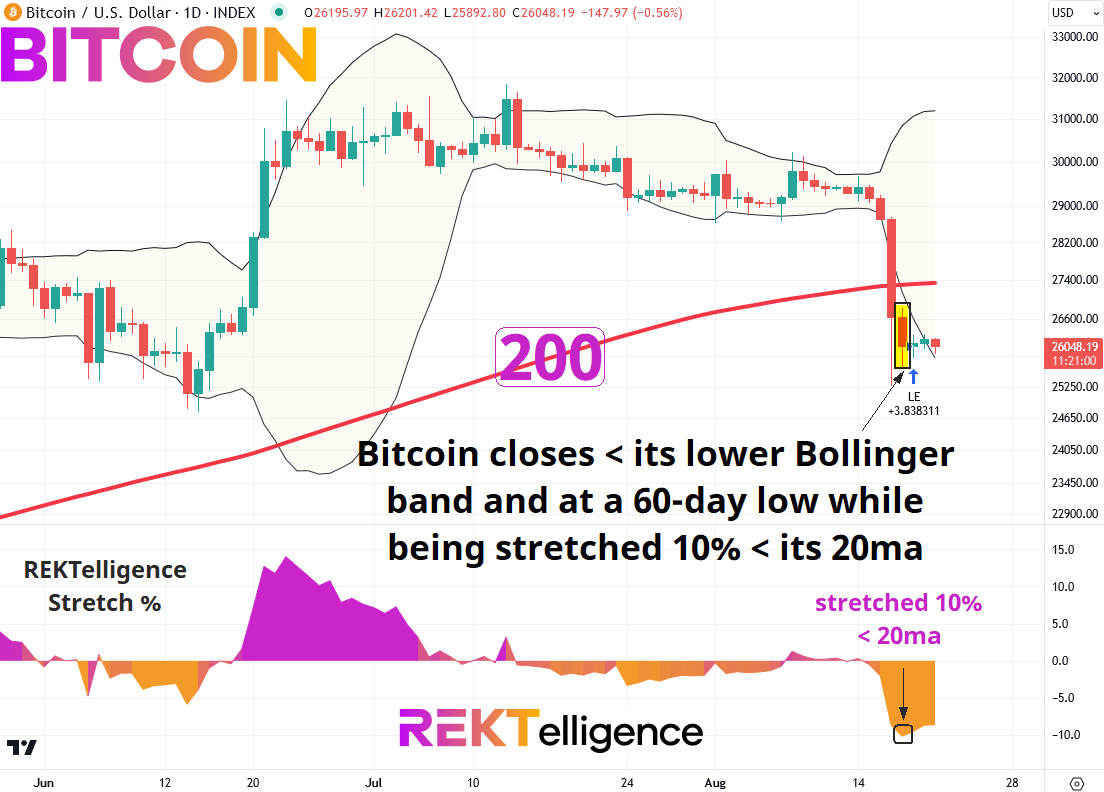
A few key technical factors best describe last week’s action: Bitcoin closed at least 10% below its 20ma (measured by our Stretch % indicator), at a 60-day low, and below its lower Bollinger band (an easy feat however with bands as tight as they were prior to the selloff). To add proper context, we also included two 200-day moving average (200ma) conditions. Widely watched, the 200ma acts as a filter and frequent dividing line between bullish and bearish regimes. With this in mind, our conditions reflect the favorable state of Bitcoin year-to-date (200ma is rising) as well as the sudden breakdown below it (BTCUSD has now closed < 200ma).
OUR BITCOIN QUERY'S SETUP CONDITIONS:

CONDITION 1: Bitcoin closes below its lower Bollinger Band
CONDITION 2: Bitcoin closes at least 10% below its 20ma (Stretch %)
CONDITION 3: Bitcoin closes at a 60-day low
CONDITION 4: Bitcoin closes below its 200ma
CONDITION 5: Bitcoin's 200ma is rising


ENTRY AND EXIT CONDITIONS:

1. ENTRY CONDITION: Enter long ("buy") at the open of the next candle
2. EXIT CONDITION: Exit ("sell") N-days later
Here are the results with a variety of hold times:
BITCOIN (BTC/USD). Hold Time Results with Win % and Average Trade. 2011-Now.
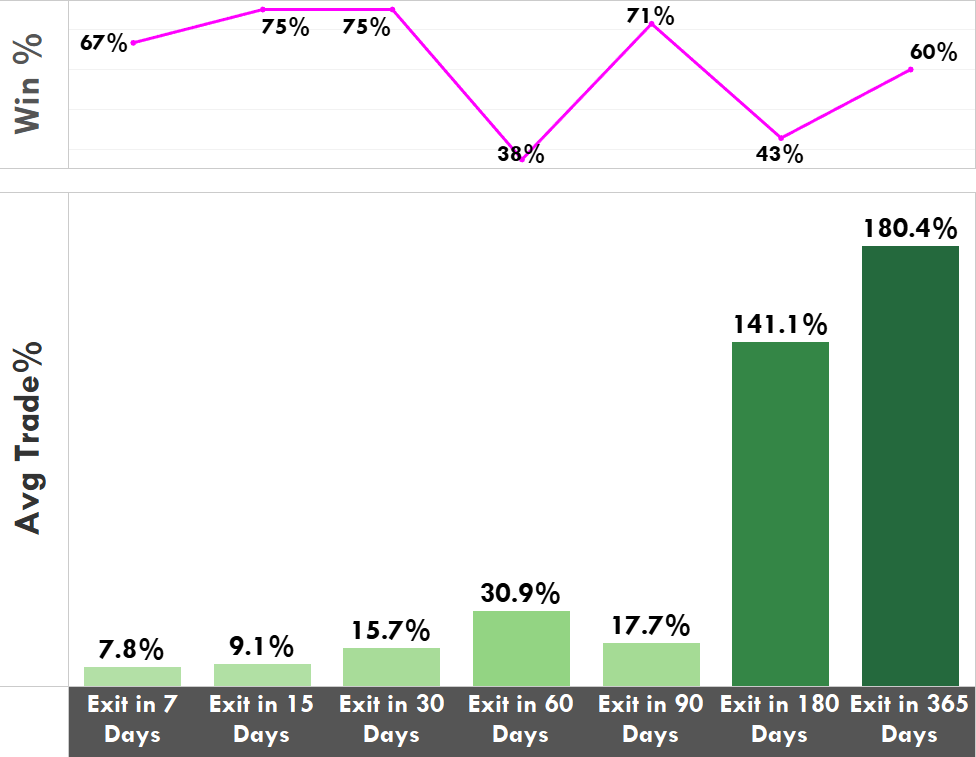
The immediate upshot and takeaway here is that historical average trade results are bullish following similar setups in the past. The further good news? It’s across all hold times we examine, from 7 days through a full year.
Clear standouts are the 6-month and 1-year holds, delivering average trades of +141.1% and +180.4% respectively.
More erratic is the percentage profitable, or “Win %.” While most hold times have seen profitability rates of 60% or higher following similar setups, the 60-day and 180-day hold times fall way short, landing below 50%. But please note that the average trade stats for both the 60-day and 180-day hold times remain solidly positive despite the lower level of profitability.
Now let’s look at Bitcoin’s results for Largest Loss (“worst trade”) next to the same average trade results. Importantly, largest loss results speak to risk and can provide perspective on what’s beneath the surface of the average trade results.
BITCOIN (BTC/USD). Largest Loss Results for Various Hold Times. 2011-Now.

Less encouraging are the largest loss stats, which suggest that 50% haircuts in Bitcoin’s price have occurred previously following similar setups. Ouch.
But when did these occur?
Largest Loss (180-day Hold): a worst hypothetical trade of -50.6% closed out in July of 2022 during last year’s macro bear market (entered in Jan 2022 at the start of last year’s bear )
Largest Loss (365-day Hold): a worst hypothetical trade of -50.1% closed out in February of 2019 during last year’s macro bear market (entered in Feb 2018 during the prior Crypto Winter)
While the specter of another 50% haircut can’t be discounted, both of the largest loss stats here occurred in hypothetical trades *entered* in bear market years.
With average trade stats still bullish across the board, and the largest loss stats occurring during trades entered during epic bear markets — something we’re likely beyond — we view last week’s selloff as a technical setback but not the start of a new downtrend. Outliers are always possible, but we’ll stick with the evidence for now.
P.S. Please feel free to SHARE this report! For now it’s free and we appreciate you spreading the word! Thank you. -DB
THE TLDR
A Few Key Takeaways
✔ Time to freak out? The darkness before the dawn?  Stats and context guide us at times like these
✔ The immediate upshot and takeaway here is that historical average trade results are bullish following similar setups in the past. The further good news? It’s across all hold times we examine, from 7 days through a full year.
✔ The largest loss stats occurring during trades entered during epic bear markets — something we’re likely beyond
peace_love_crypto-DB

IMPORTANT DISCLAIMER
The information presented and made available in this newsletter is intended for educational purposes only. THE INFORMATION IS NOT AND SHOULD NOT BE CONFUSED WITH INVESTMENT ADVICE AND DOES NOT ATTEMPT OR CLAIM TO BE A COMPLETE DESCRIPTION OF ANY SPECIFIC COINS, TOKENS OR MARKETS OF ANY KIND, BUT RATHER EDUCATIONAL EXAMPLES OF THE APPLICATION OF TECHNICAL ANALYSIS AND QUANTITATIVE ANALYSIS TO THE MARKET. This information has been presented and prepared without regard to any particular person's investment objectives, financial situation and particular needs because as individuals come from diverse backgrounds, with diverse objectives and financial situations. This information is of a general nature only so you should seek advice from your investment advisor or other financial professional as appropriate before taking any action. The opinions and analyses included herein are based on sources and data believed to be reliable and are presented in good faith, however no representation or warranty, expressed or implied is made as to their completeness or accuracy. It is imperative to understand your investment risks since all stock investments involve significant risk. The user of REKTelligence’s newsletters, podcasts, courses, coaching and other educational services agrees to indemnify and hold harmless REKTelligence LLC from and against any and all liabilities, expenses (including attorney's fees), and damages arising out of claims resulting from the use of this educational content. REKTelligence LLC is not a licensed investment advisor.
© 2023 REKTelligence LLC