


A Major Ethereum Signal Just Hit Today
A Look at Ether's New 100ma/200ma Crossover Signal

IN TODAY’S REPORT
What we cover: A major bullish moving average crossover in Ether. Historical hypothetical trades scatter. Charts of past signals. We couldn’t disagree more…
TODAY’S STATS
The Signal Nobody’s Talking About
Amid a newly resurgent altcoin market and the breathless anticipation of an imminent spot Bitcoin ETF approval, Ethereum just experienced a major moving average crossover. You won’t find mention of it on today’s crypto news desks or see it trending on X, but Ether’s 100-day moving average (100ma) just crossed above its 200-day moving average (200ma), and in today’s report we’ll examine why it’s one to pay close attention to.
ETHERERUM (ETH/USD). Daily Chart with 100ma and 200ma crossover.
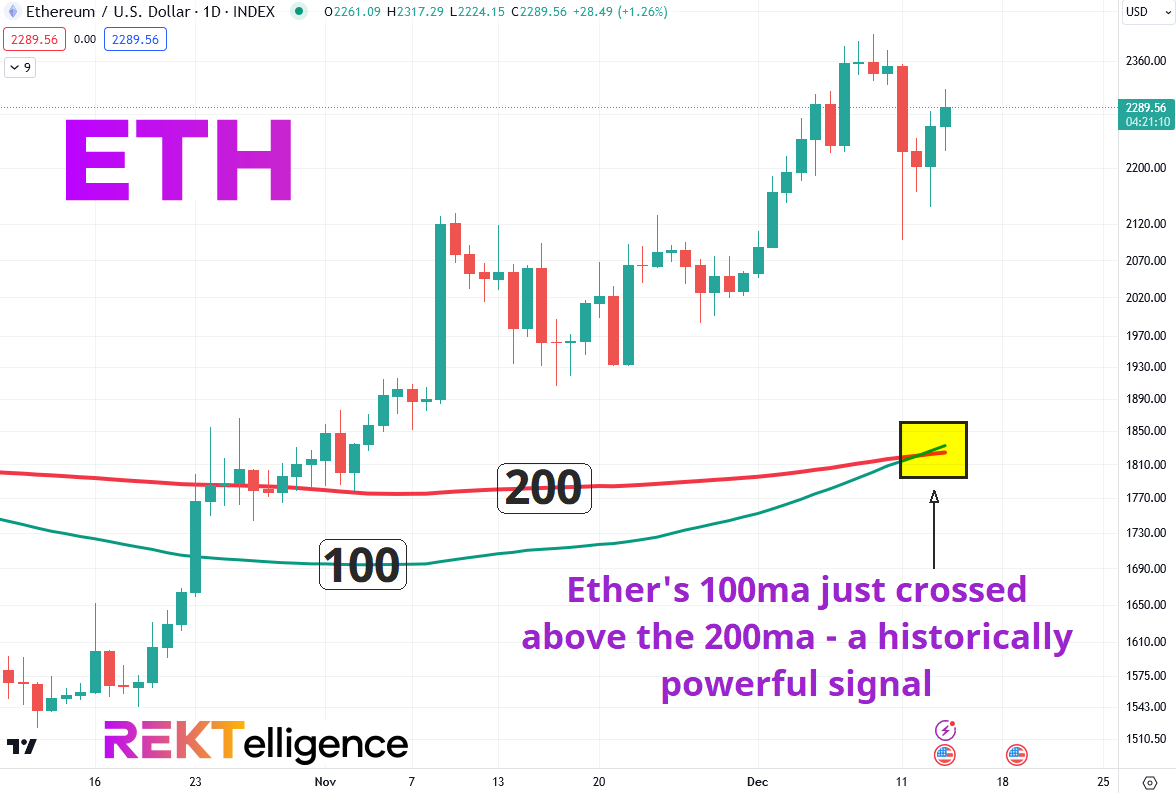
Our first query is simple: how has Ether performed historically when its 100-day moving average (100ma) crosses over (i.e., becomes greater than the value of) its 200-day moving average (200ma)?
OUR ETHER QUERY'S SETUP CONDITIONS:

CONDITION 1: Ether's 100ma crosses over its 200ma


ENTRY AND EXIT CONDITIONS:

1. ENTRY CONDITION: Enter long ("buy") at the open of the next daily candle
2. EXIT CONDITION: Exit ("sell") at the open of the next daily candle once the 100ma crosses below the 200ma
Here are the past trades for all completed historical signals:
ETHER (ETH/USD). Closed Trades for 100ma/200ma crosses. Inception-Now.
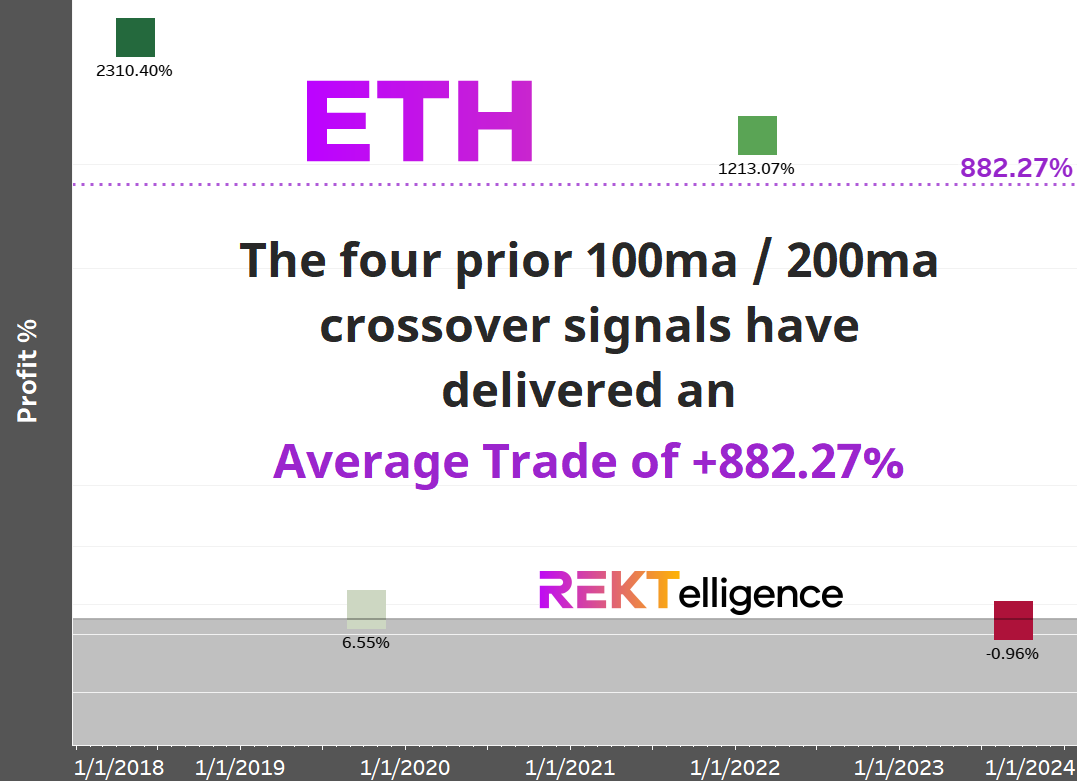
The four historical occurrences have been profitable 75% of the time (3 of 4) with an impressive hypothetical average trade of +882.27%. While the average trade statistic will almost certainly moderate in years to come, this crossover certainly has our attention. For risk-obsessed traders and investors, the equally compelling fact is that the sole losing crossover signal shed less than one percent (-0.96%). Historically speaking, these crossover signals have either knocked it out of the park or hit a sacrificial fly to the outfield — impressive either way.
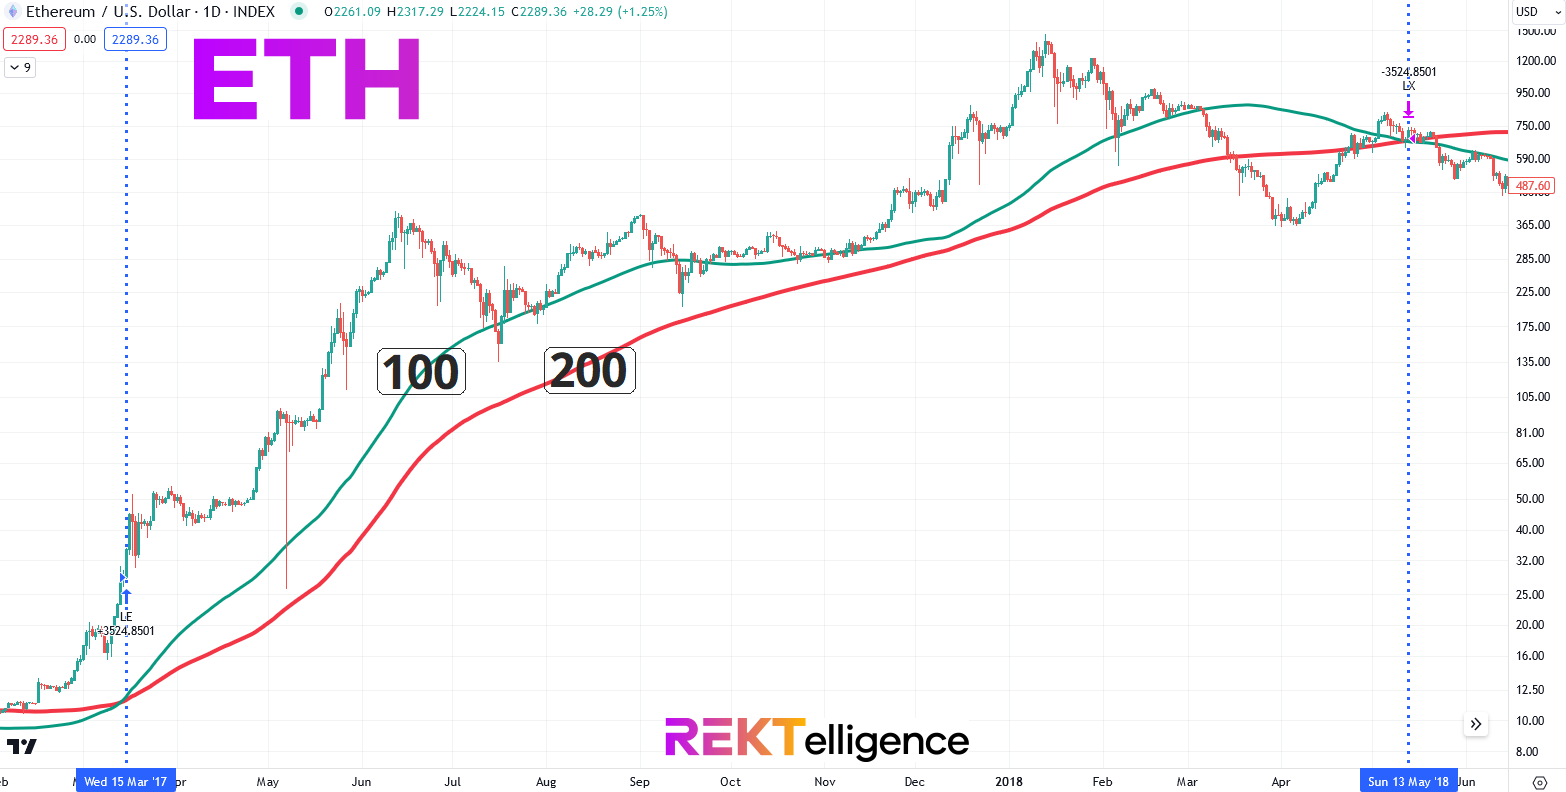
Since we have just four prior occurrences, let’s take a look at the charts for each. In March 2017, we saw Ethereum’s first 100ma >200ma crossover occur, leading to an eye-popping +2310% gain by May 2018.
ETHER (ETH/USD). Historical Daily Chart with 2017’s 100ma and 200ma crossover.
Ethereum’s second 100ma >200ma crossover in May 2019 initially saw a solid runup before ultimately closing out in October 2019 with a modest +6.55% gain.
ETHER (ETH/USD). Historical Daily Chart with 2019’s 100ma and 200ma crossover.

The last bull cycle of 2020 saw Ether’s other major signal gain 1213.07% in just under two years time, ending as the macro environment shifted in a major way in early 2022.
ETHER (ETH/USD). Historical Daily Chart with 2020’s 100ma and 200ma crossover.

The most recent completed 100ma/200ma crossover signal occurred this year, leading to the sole loss as ETH slumped in September. Note the new signal which occurred today 12/14/23 and which of course remains open.
ETHER (ETH/USD). Historical Daily Chart with 2023’s 100ma and 200ma crossover.

While some cry loudly that crypto has no “killer app” and Ethereum remains just a speculative project with few prospects going forward, we couldn’t disagree more. The web3 world is being built largely on the layer 1 foundation of Ethereum, with some arguing convincingly that stablecoins are already the highly adopted killer app everyone’s been looking for. In time, Ethereum will help provide the world with sorely-needed new financial infrastructure, enable an artistic middle class, and so much more.
For now, however, we’ll be satisfied to revel in another 100ma/200ma crossover signal and enjoy the show. It just may be the blockbuster we can all enjoy for the holidays.
peace_love_crypto-DB
IMPORTANT DISCLAIMER
The information presented and made available in this newsletter is intended for educational purposes only. THE INFORMATION IS NOT AND SHOULD NOT BE CONFUSED WITH INVESTMENT ADVICE AND DOES NOT ATTEMPT OR CLAIM TO BE A COMPLETE DESCRIPTION OF ANY SPECIFIC COINS, TOKENS OR MARKETS OF ANY KIND, BUT RATHER EDUCATIONAL EXAMPLES OF THE APPLICATION OF TECHNICAL ANALYSIS AND QUANTITATIVE ANALYSIS TO THE MARKET. This information has been presented and prepared without regard to any particular person's investment objectives, financial situation and particular needs because as individuals come from diverse backgrounds, with diverse objectives and financial situations. This information is of a general nature only so you should seek advice from your investment advisor or other financial professional as appropriate before taking any action. The opinions and analyses included herein are based on sources and data believed to be reliable and are presented in good faith, however no representation or warranty, expressed or implied is made as to their completeness or accuracy. It is imperative to understand your investment risks since all stock investments involve significant risk. The user of REKTelligence’s newsletters, podcasts, courses, coaching and other educational services agrees to indemnify and hold harmless REKTelligence LLC from and against any and all liabilities, expenses (including attorney's fees), and damages arising out of claims resulting from the use of this educational content. REKTelligence LLC is not a licensed investment advisor.
© 2023 REKTelligence LLC