A Key Indicator Suggests ETH Volatility May Soon Reawaken
IN TODAY’S LETTER
What we cover: ETH’s declining volatility sets up a potentially great opportunity. Low ADX readings often precede major moves. The FOMC appears ready to hike to 5.25% - same as at the Dawn of Bitcoin.
TODAY’S STATS
A Data-Driven Look at ETHER’s ADX Indicator
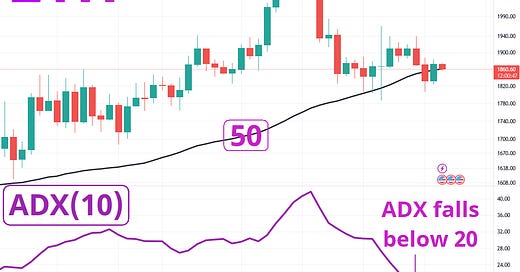
Ether’s volatility has been declining after its recent challenge of the 2000 area and subsequent pullback. One of our favorite volatility measures is the Average Directional Index, a.k.a. ADX indicator. Low ADX levels indicate a trendless market or simply a diminishing trend, and typically precede large breakouts or breakdowns. In other words, low ADX levels often occur right before large price moves as volatility reawakens. With Ether’s 10-day ADX having now fallen below the 20 level, it’s time to take a look at the stats.
ETHER (ETH/USD). Daily Chart with rising 50ma and ADX(10) Indicator.
Today’s query: What’s happened in the past when Ether’s ADX(10) closed below 20 and ETH was above its rising 50ma. We’ll first look at a simple “sell 90 days later” scenario before looking at various holding times.
OUR ETHER QUERY'S SETUP CONDITIONS:

CONDITION 1: Ether's ADX(10) Indicator closes below 20
CONDITION 2: Ether closes above its 50-day moving average (50ma)
CONDITION 3: Ether's 50-day moving average (50ma) is rising


ENTRY AND EXIT CONDITIONS:

1. ENTRY CONDITION: Enter long ("buy") at the open of the next daily candle
2. EXIT CONDITION: Exit ("sell") 90 days later
Here are the results using a 90-day hold:
ETHER (ETH/USD). Query Results for ETH with a 90-day Hold. Inception-Now.
The 13 historical occurrences have been profitable nearly 61.5% of the time with an amazing average trade of +82.6% over a 90-day holding period.
While historical occurrences are limited at only 13, the Profit Factor is nevertheless impressive at 7.85, well above a “breakeven” / neutral Profit Factor reading of 1.00. With a 90-day hold, this appears to be a strongly positive intermediate-term edge, although ideally we’d have more instances to consider.
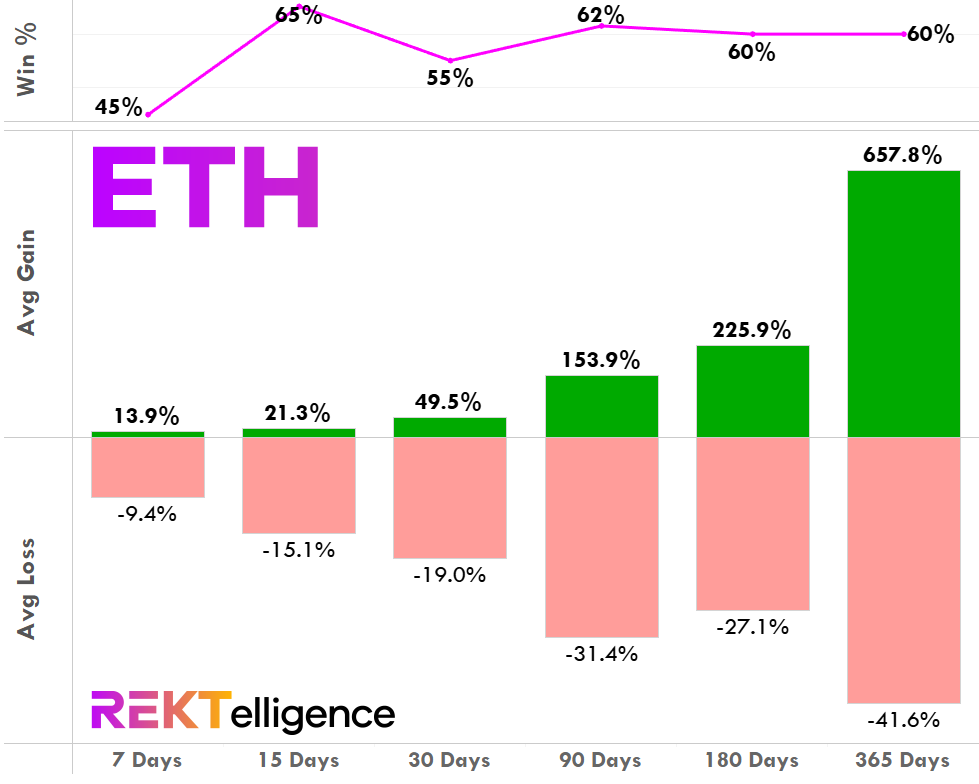
Now let’s look at Ether’s results for Average Gain and Average Loss across various holding times ranging from 7-days to a year. Note that the Win % shows how many trades were profitable, hypothetically speaking.
ETHER (ETH/USD). Holding Time Results for Today’s Conditions. Inception-Now.
Over all of the holding times we examined, the average gain exceeded the average loss. Starting with a 30-day hold, the average gain is greater than two times the average loss, a trait that grows with subsequent hold times out to one year.
THE TECHNICAL VIEW
Rates Back at 5.25%. Same as at the Dawn of Bitcoin.
While we’ve provided our detailed technical view in recent letters (see Monday’s for the most recent), today we have a singular focus: the FOMC announcement at 2pm ET. The expected rate hike of 25 basis points (0.25%) will bring the Fed’s rate to 5.25%, a rate not seen since the Summer of 2007. Right before the Great Recession. Right before the Great Financial Crisis. Right before the Dawn of Bitcoin. We may write much more about this soon, but for now it is enough to say that with three out of four of the largest bank failures in U.S. history having occurred within the last two months and rates (most likely) about to climb to back to 5.25%, our unwavering conviction that Bitcoin is the hardest money ever created remains stronger than ever. Long live Satoshi.
THE TLDR
A Few Key Takeaways
✔ Ether’s volatility has been declining after its recent challenge of the 2000 area
✔ Low ADX levels often occur right before large price moves as volatility reawakens
✔ Past instances produced an amazing average trade of +82.6% over a 90-day hold
✔ Rates likely to return back to 5.25%. Same as at the Dawn of Bitcoin
peace_love_crypto-DB
IMPORTANT DISCLAIMER
The information presented and made available in this newsletter is intended for educational purposes only. THE INFORMATION IS NOT AND SHOULD NOT BE CONFUSED WITH INVESTMENT ADVICE AND DOES NOT ATTEMPT OR CLAIM TO BE A COMPLETE DESCRIPTION OF ANY SPECIFIC COINS, TOKENS OR MARKETS OF ANY KIND, BUT RATHER EDUCATIONAL EXAMPLES OF THE APPLICATION OF TECHNICAL ANALYSIS AND QUANTITATIVE ANALYSIS TO THE MARKET. This information has been presented and prepared without regard to any particular person's investment objectives, financial situation and particular needs because as individuals come from diverse backgrounds, with diverse objectives and financial situations. This information is of a general nature only so you should seek advice from your investment advisor or other financial professional as appropriate before taking any action. The opinions and analyses included herein are based on sources and data believed to be reliable and are presented in good faith, however no representation or warranty, expressed or implied is made as to their completeness or accuracy. It is imperative to understand your investment risks since all stock investments involve significant risk. The user of REKTelligence’s newsletters, podcasts, courses, coaching and other educational services agrees to indemnify and hold harmless REKTelligence LLC from and against any and all liabilities, expenses (including attorney's fees), and damages arising out of claims resulting from the use of this educational content. REKTelligence LLC is not a licensed investment advisor.
© 2023 REKTelligence LLC


