


8 Days Down for Bitcoin? Expect Struggle

IN TODAY’S LETTER
What we cover: On Saturday, Bitcoin experienced 8 days down - a rare occurrence. We examine what’s next after Bitcoin closes lower for 8 straight days. We’d welcome an exception to the stats (which looks possible). Alt Season it ain’t.
TODAY’S STATS
Eight Days Down for Bitcoin is Rare… and Ugly Historically.
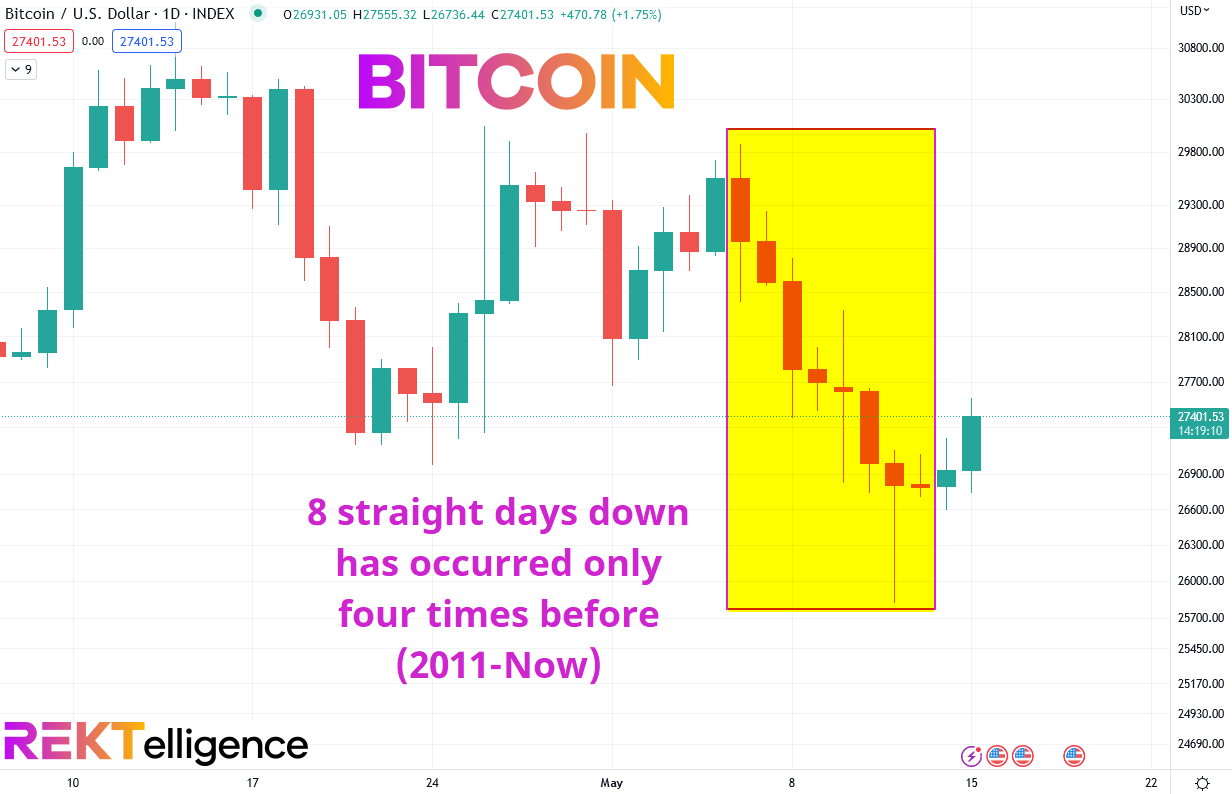
By the completion of Saturday’s daily candle, Bitcoin experienced eight straight lower daily closes as it pulled back down to its rising 100ma. As we stated in our last letter, the king crypto has made little progress in either direction since its March runup to the current range between roughly 26,900 - 30,000. With this in mind, what does our data say about Bitcoin after so many consecutively lower closes? We’ll examine the evidence, specifically how Bitcoin has fared after eight straight days down. Before we get to that, however, it’s important to understand how holding time affects occurrences. Hypothetically speaking, using data from 2011 to now, if we look at buying Bitcoin after it closes lower for eight straight days using a simple one-day hold, we find that there have been only four occurrences of this setup - a truly rare event. As we increase our holding time, there will be even fewer instances due to the fact that the query (test) may still be holding a hypothetical position when another instance of the setup occurs. Naturally, this would prevent the test from entering a new position when it already has an existing position, and the latest occurrence will not be counted. Regardless of hold time, occurrences of eight straight days down for Bitcoin is unequivocally rare.
BITCOIN (BTC/USD). Daily Chart with 8 straight lower closes.
Today’s query is as simple as it gets: how has Bitcoin performed historically when it closes lower for 8 straight days? We’ll first look at stats for a “sell in 7 days” holding time before looking at various holding times.
OUR BITCOIN QUERY'S SETUP CONDITIONS:

CONDITION 1: Bitcoin closes lower for 8 straight days


ENTRY AND EXIT CONDITIONS:

1. ENTRY CONDITION: Enter long ("buy") at the open of the next daily candle
2. EXIT CONDITION: Exit ("sell") 7 days later
Here are the results:
BITCOIN (BTC/USD). Results for today’s BTC Conditions with 7-day hold. 2011-Now.

Since 2011, while occurrences are few and not statistically significant, every instance of this setup using a 7-day hold has been negative in any year in which it has occurred. While this is clearly bearish, the silver lining may be that the worst trade is only -17.4%, far from the typical worst trade even with a short-term holding time window. In fact, the average trade of -9.3% over 7 days more or less matches our recent Technical View (see below as well as recent letters). Bitcoin remains in technical purgatory, generally speaking, and these stats are in line with that view.
More importantly, let’s see how this setup has fared over multiple holding times.
BITCOIN (BTC/USD). Holding Time Results for Today’s Conditions. 2011-Now.
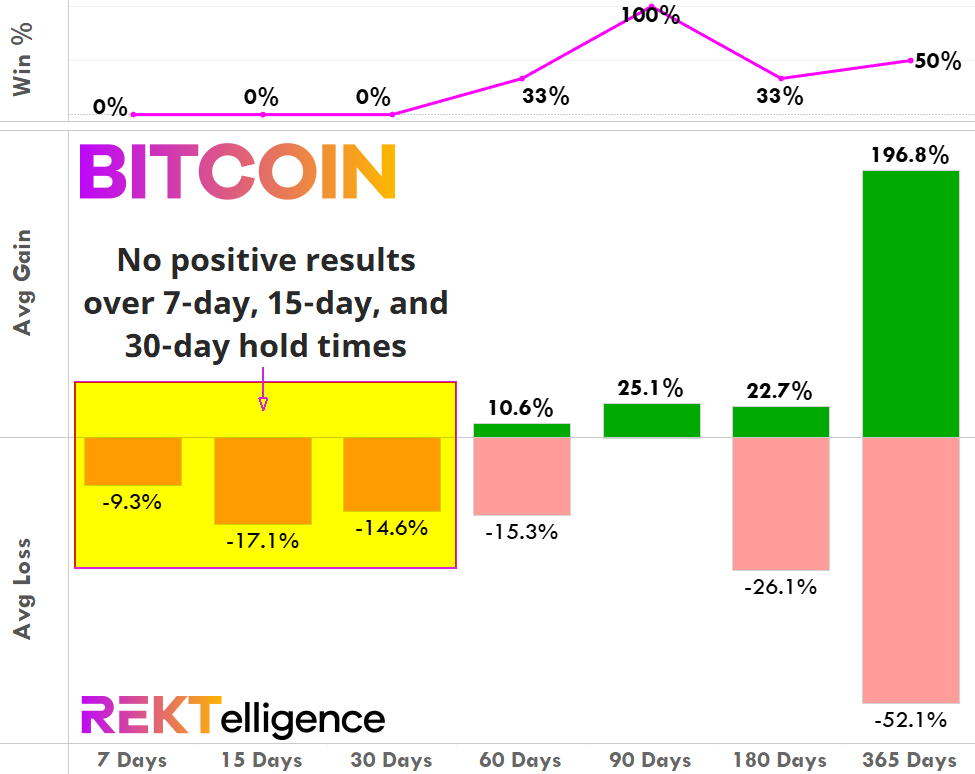
Once again, the results appear to confirm our concern for Bitcoin in the short to intermediate-term timeframes. With no positive results over 7-day, 15-day, and 30-day hold times (i.e., a 0% win rate), the outlook for Bitcoin in the near-term looks modestly bearish. That said, if there was going to be an exception to these results, the current Bitcoin setup may have the right ingredients. Why? The 8-day pullback ended at the rising 100ma, occurred after a bullish Hammer candle had formed, and held at the area of the late March lows. The stats are clearly bearish in the short-term, but the current setup looks to have the potential to surprise us. We’d gladly welcome the exception.
THE TECHNICAL VIEW
Alt Season? Hardly.
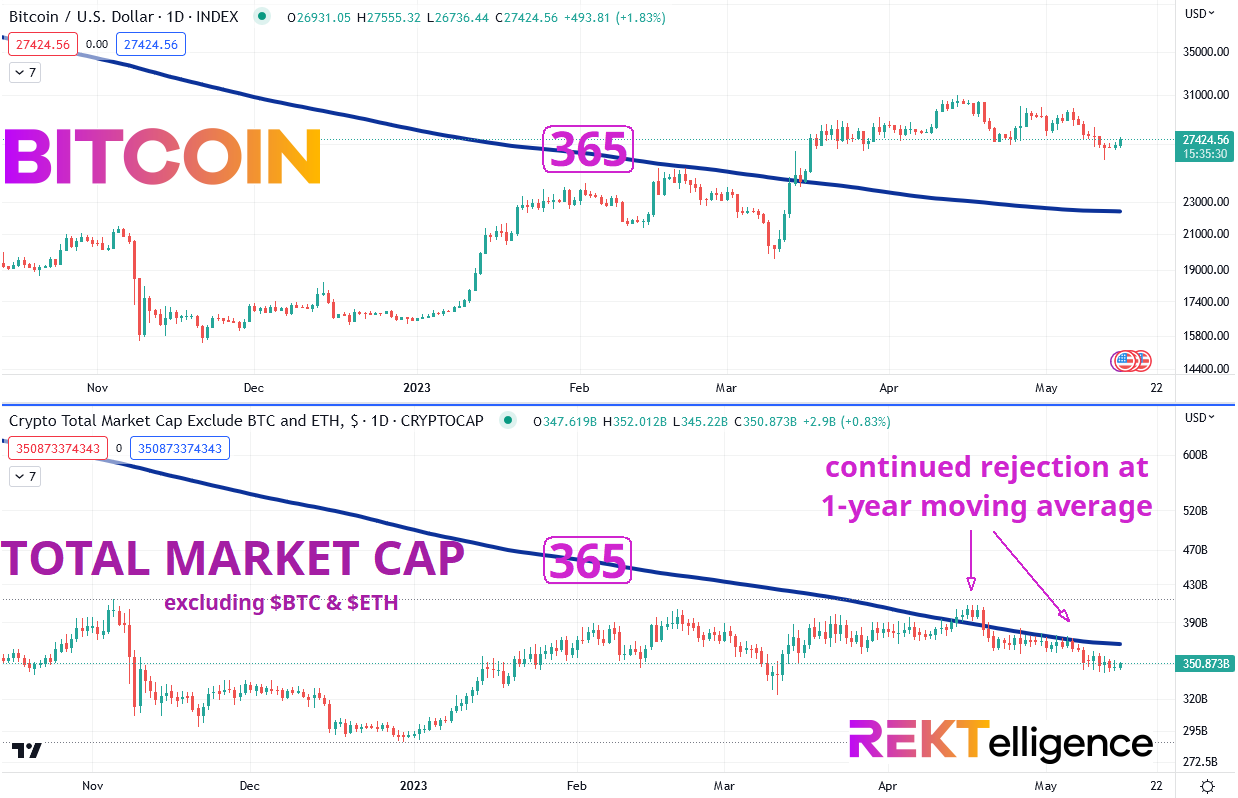
While many on Crypto Twitter marvel (or wince) at the latest spectacular up or down swing in meme-coin darling PEPE, the performance of most altcoins lags noticeably behind both Bitcoin and Ether. An overlay comparison of Bitcoin and TOTAL3 (total crypto market cap excluding BTC and ETH) shows a continued rejection of altcoins at the declining 1-year moving average, a benchmark which Bitcoin long ago surpassed. Less than 1.5 quarters past 2022’s combined macro/crypto treachery, investors remain tenuously confident in large cap cryptos like Bitcoin and Ethereum - both which have held their gains reasonably well - but unwilling to take the same stance in alts more broadly. Additionally, TOTAL3 still sits below its November pre-FTX collapse high, another negative for the altcoin space. As always, we’ll be on the lookout for meaningful broad-based signs of life among alts, but for now please know it’s dicey out there. Alt Season? Hardly. You can tell Crypto Twitter that it will come again when liquidity returns in full, but for now… Alt Season it ain’t.
BITCOIN (BTC/USD) vs. TOTAL3. Daily Chart with 365ma. November 2022 - Now.
THE TLDR
A Few Key Takeaways
✔ Occurrences of eight straight days down for Bitcoin is unequivocally rare
✔ No positive results over 7-day, 15-day, and 30-day hold times
✔ The current setup looks to have the potential to surprise us
✔ Confidence still holds for BTC, but investors have not yet embraced alts broadly
peace_love_crypto-DB
IMPORTANT DISCLAIMER
The information presented and made available in this newsletter is intended for educational purposes only. THE INFORMATION IS NOT AND SHOULD NOT BE CONFUSED WITH INVESTMENT ADVICE AND DOES NOT ATTEMPT OR CLAIM TO BE A COMPLETE DESCRIPTION OF ANY SPECIFIC COINS, TOKENS OR MARKETS OF ANY KIND, BUT RATHER EDUCATIONAL EXAMPLES OF THE APPLICATION OF TECHNICAL ANALYSIS AND QUANTITATIVE ANALYSIS TO THE MARKET. This information has been presented and prepared without regard to any particular person's investment objectives, financial situation and particular needs because as individuals come from diverse backgrounds, with diverse objectives and financial situations. This information is of a general nature only so you should seek advice from your investment advisor or other financial professional as appropriate before taking any action. The opinions and analyses included herein are based on sources and data believed to be reliable and are presented in good faith, however no representation or warranty, expressed or implied is made as to their completeness or accuracy. It is imperative to understand your investment risks since all stock investments involve significant risk. The user of REKTelligence’s newsletters, podcasts, courses, coaching and other educational services agrees to indemnify and hold harmless REKTelligence LLC from and against any and all liabilities, expenses (including attorney's fees), and damages arising out of claims resulting from the use of this educational content. REKTelligence LLC is not a licensed investment advisor.
© 2023 REKTelligence LLC