


4 Days Down for Bitcoin? Here's What's Next

IN TODAY’S LETTER
What we cover: We examine what’s next after Bitcoin closes lower for 4 straight days. On Tuesday BTC experienced 4 days down while below the 50ma and above the 100ma. The 60-day Hold Time stands out historically. The 28,750 to 34,800 supply zone.
TODAY’S STATS
Four Days Down for Bitcoin Suggests We’re Usually Higher 7 Days Out
By the completion of Tuesday’s daily candle, Bitcoin experienced four straight lower daily closes as it fell back below its 50MA. The king crypto has made little progress in either direction since its March runup to the current range between roughly 26,900 - 30,000. While many discuss the potential significance of the (highly debatable) daily head and shoulders pattern, we’ll take a look at the evidence, specifically how Bitcoin has fared after 4 straight days down when below its 50ma but above its 100ma.
BITCOIN (BTC/USD). Daily Chart with 50ma, 100ma, and 4 straight lower closes.

As usual, our first query is simple: how has Bitcoin performed historically when it closes lower for 4 straight days, also closes below its 50ma but above its 100ma? We’ll first look at stats for a “sell in 7 days” holding time before looking at various holding times.
OUR BITCOIN QUERY'S SETUP CONDITIONS:

CONDITION 1: Bitcoin closes lower for 4 straight days
CONDITION 2: Bitcoin closes below its 50ma
CONDITION 3: Bitcoin closes above its 100ma


ENTRY AND EXIT CONDITIONS:

1. ENTRY CONDITION: Enter long ("buy") at the open of the next daily candle
2. EXIT CONDITION: Exit ("sell") 7 days later
Here are the results:
Bitcoin (BTC/USD). Results for today’s BTC Conditions with 7-day hold. 2011-Now.

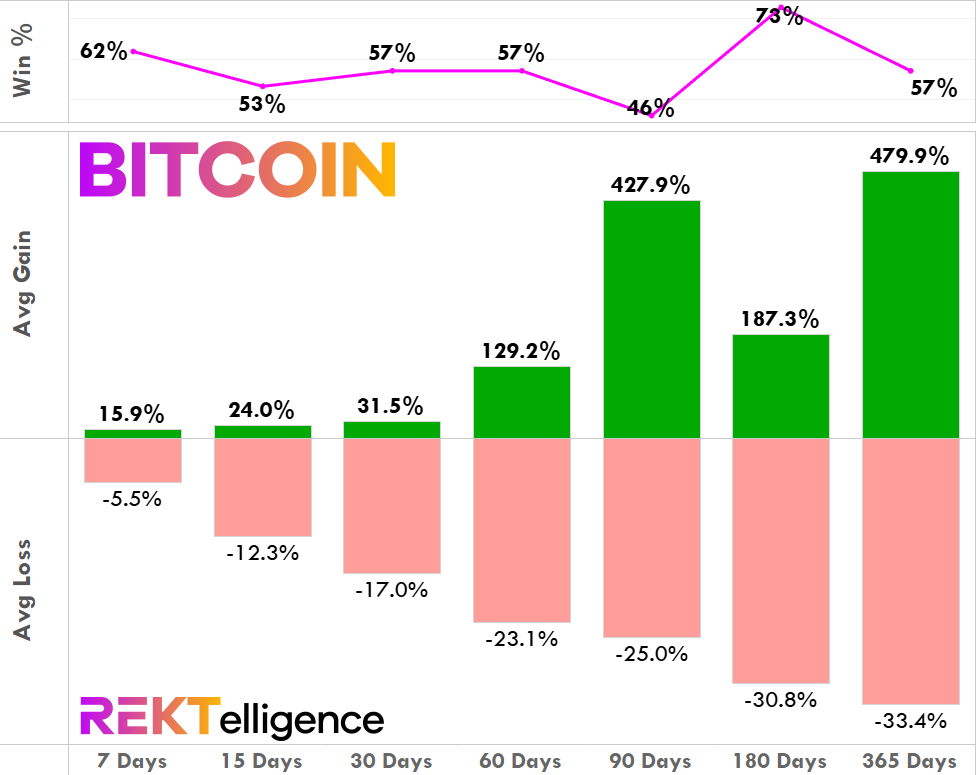
Since 2011, there have been 21 occurrences of these conditions and almost 62% of them have been positive 7 days later. While the average trade of +7.8% is certainly not eye-popping to most traders, we’re talking about a very short-term hold of only 7 days. With this in mind, the one week hold here looks impressive, especially when also considering the average one week gain of +15.9% and average one week loss of -5.5% (shown later in the Holding Times chart). Most notable is the profit factor of 4.66, indicating that the sum of gross gains is over 4.5 times the sum of gross losses. With 21 past instances of the setup, this profit factor is outstanding. Bottom line, short-term traders should certainly consider the stats here in the context of their own ideas and process.
We’ve now added the 60-day holding time to give readers a statistical perspective on a roughly one month, two month and three month hold times, bridging the gap from short term to intermediate term by most traders’ definitions.
What stands out when looking at all the stats for Bitcoin’s four consecutive lower closes, a close < the 50ma, and a close > the 100ma condition set is the dramatic jump in average gain starting with the 60-day hold. While the short-term hold times out to 30 days are rather modest for Bitcoin, the 60-day hold has historically delivered a +129.2% average gain with only a -23.1% average loss. This setup appears to have a solid upside skew.
Bitcoin (BTC/USD). Holding Time Results for Today’s Conditions. 2011-Now.
THE TECHNICAL VIEW
Weekly Supply Zone Reigns
As we said in late April, the 28,750 to 34,800 area remains the major obstacle to price in the short-term and this area continues to present a major obstacle to further upside progress for Bitcoin. While today’s stats are favorable, not all setups pay off. If we do not see upside progress over the next 7 days, we’ll most likely attribute that to this supply area where many prior lows exist from the last bull cycle. We’re still in technical Purgatory, at least for now.
“The 28,750 to 34,800 area remains the intermediate-term concern. With significant prior price history (mostly swing lows from the past bull market) sitting just overhead, Bitcoin will likely remain stuck in this area for the foreseeable future, especially with the next halving so many months away and recession fears looming just beyond the horizon. The “Halving vs. Recession” debate is the central tension dominating Bitcoin at present. Throw in a healthy pinch of regulation speculation and you’ve got Ether’s central dilemma. The good news? The current wall of worry for crypto grows, and this may be just what the bulls need to climb over in the long-term.”
As always, when there’s meaningful progress and a change to our technical view, we’ll share it here immediately.
BITCOIN (BTC/USD). Weekly Heikin Ashi Chart. October 2020 - Now.

THE TLDR
A Few Key Takeaways
✔ There have been 21 occurrences and 61.9% of them positive 7 days out
✔ The profit factor of 4.66 is outstanding
✔ The 60-day hold has historically delivered a +129.2% average gain
✔ The 28,750 to 34,800 area remains major obstacle to short-term Bitcoin upside
peace_love_crypto-DB
IMPORTANT DISCLAIMER
The information presented and made available in this newsletter is intended for educational purposes only. THE INFORMATION IS NOT AND SHOULD NOT BE CONFUSED WITH INVESTMENT ADVICE AND DOES NOT ATTEMPT OR CLAIM TO BE A COMPLETE DESCRIPTION OF ANY SPECIFIC COINS, TOKENS OR MARKETS OF ANY KIND, BUT RATHER EDUCATIONAL EXAMPLES OF THE APPLICATION OF TECHNICAL ANALYSIS AND QUANTITATIVE ANALYSIS TO THE MARKET. This information has been presented and prepared without regard to any particular person's investment objectives, financial situation and particular needs because as individuals come from diverse backgrounds, with diverse objectives and financial situations. This information is of a general nature only so you should seek advice from your investment advisor or other financial professional as appropriate before taking any action. The opinions and analyses included herein are based on sources and data believed to be reliable and are presented in good faith, however no representation or warranty, expressed or implied is made as to their completeness or accuracy. It is imperative to understand your investment risks since all stock investments involve significant risk. The user of REKTelligence’s newsletters, podcasts, courses, coaching and other educational services agrees to indemnify and hold harmless REKTelligence LLC from and against any and all liabilities, expenses (including attorney's fees), and damages arising out of claims resulting from the use of this educational content. REKTelligence LLC is not a licensed investment advisor.
© 2023 REKTelligence LLC